
|
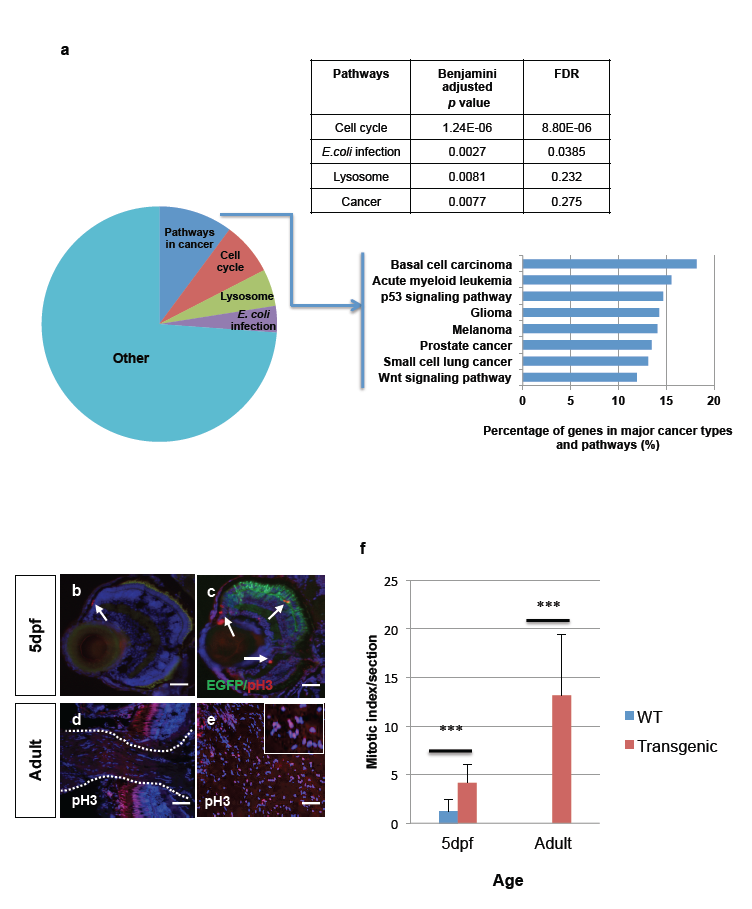
Fig. 3
Up-regulated pathways in retinal tumors and increased mitotic index in transgenic larvae and zOPGs. (a) KEGG analysis showing significantly up-regulated pathways in retinal tumors. Benjamini adjusted p values and false discovery rates (FDR) for the top four pathways are listed. For upregulated genes involved in cancer, the major cancer subtype, cancer pathways and percentage of genes in each pathway are also shown. (b) A transverse section of a retina from a wild-type zebrafish larva at 5 dpf showing a single mitotic figure at the ciliary marginal zones (CMZ, arrow). (c) A transgenic larval retina showing mitotic figures not only at CMZ, but also in central retina (arrows). (d) A transverse section of a WT retina showing no mitotic figures at the ONH. (e) Adult retinal tumor showing mitotic figures within the sparsely nucleated zOPG area. (f) Quantification of mitotic index at both larval stage and adult stage showing significantly increased mitosis in transgenic fish when compared to WT fish (n=6 each). Scale bars, 40μm.