
|
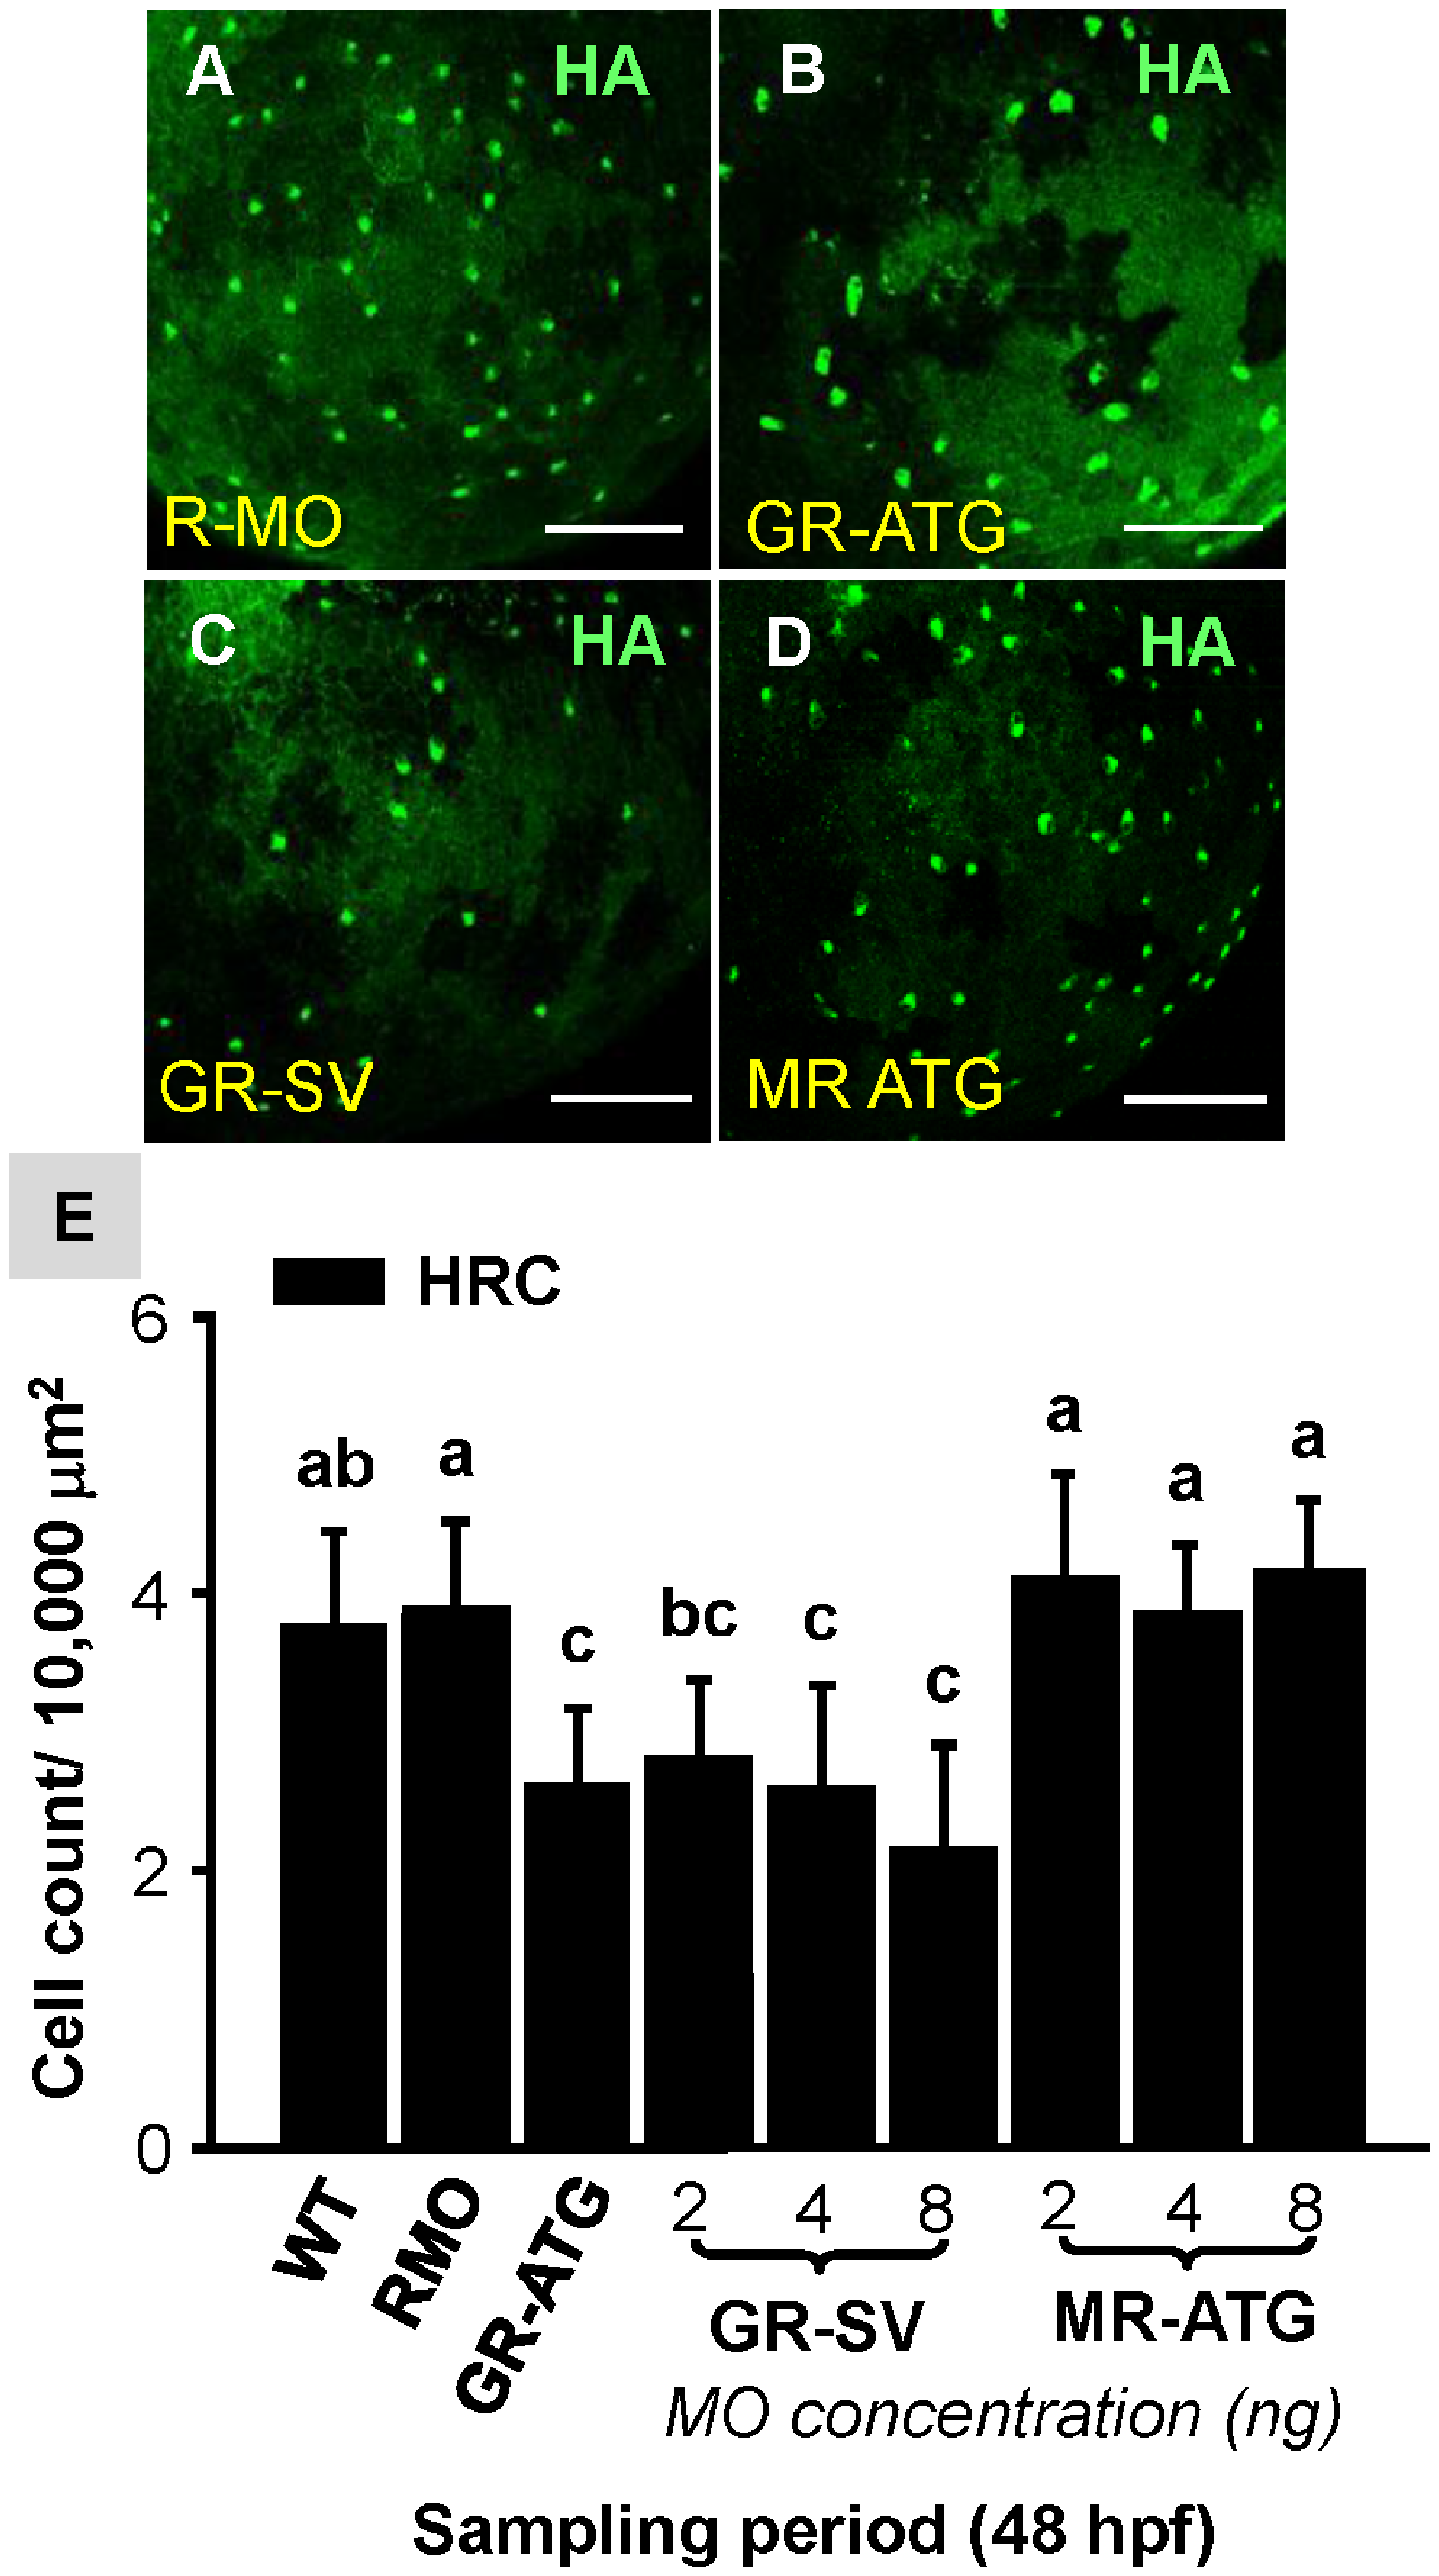
Fig. 2
Effect of corticosteroid receptor gene knockdown on HRC number.
Zebrafish embryos at the 1~4 cell-stage were microinjected with glucocorticoid receptor ATG-MO (GR-ATG), GR-splice variant MO (GR-SV), mineralocorticoid receptor ATG-MO (MR-ATG), or Random-MO (RMO; control). Representative images of yolk-sac HRCs labeled with H+-ATPase (HA) in RMO (A), GR-ATG (B), GR-SV (C), and MR-ATG (D) morphants. HRC numbers are compared in (E). Values are presented as the mean ±s.d. (n = 10–12). abIndicates statistically significant differences (<0.05) between groups as determined by one-way ANOVA (Tukey’s pair-wise comparison). Scale bar: 100 μm (A–F).