
Image
|
Figure Caption
Fig. 2
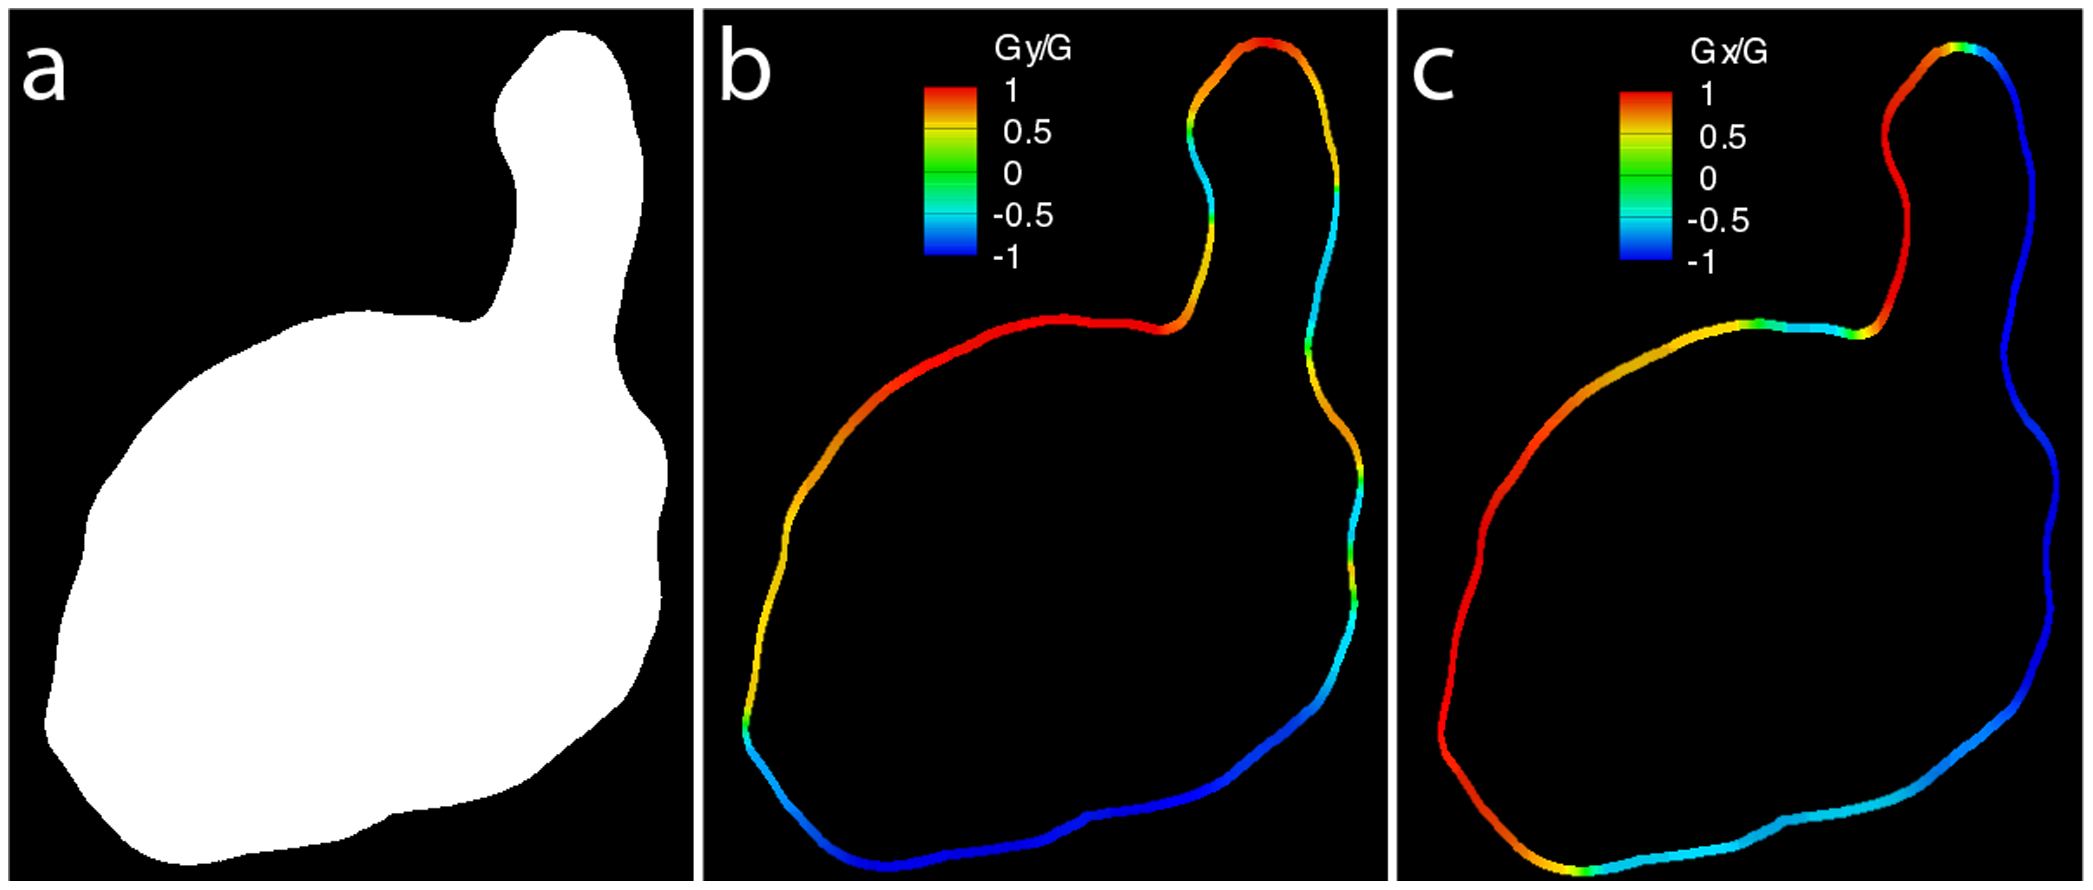
The local signal-to-noise ratio can be used to define the boundary, allowing calculation of the slope of the wall.
(a) Binary mask created by thresholding the SNR map. Colourmap of the slope at the wall in (b) the horizontal direction and (c) the vertical direction after the heart wall identification process.
Acknowledgments
This image is the copyrighted work of the attributed author or publisher, and
ZFIN has permission only to display this image to its users.
Additional permissions should be obtained from the applicable author or publisher of the image.
Full text @ PLoS One