
Image
|
Figure Caption
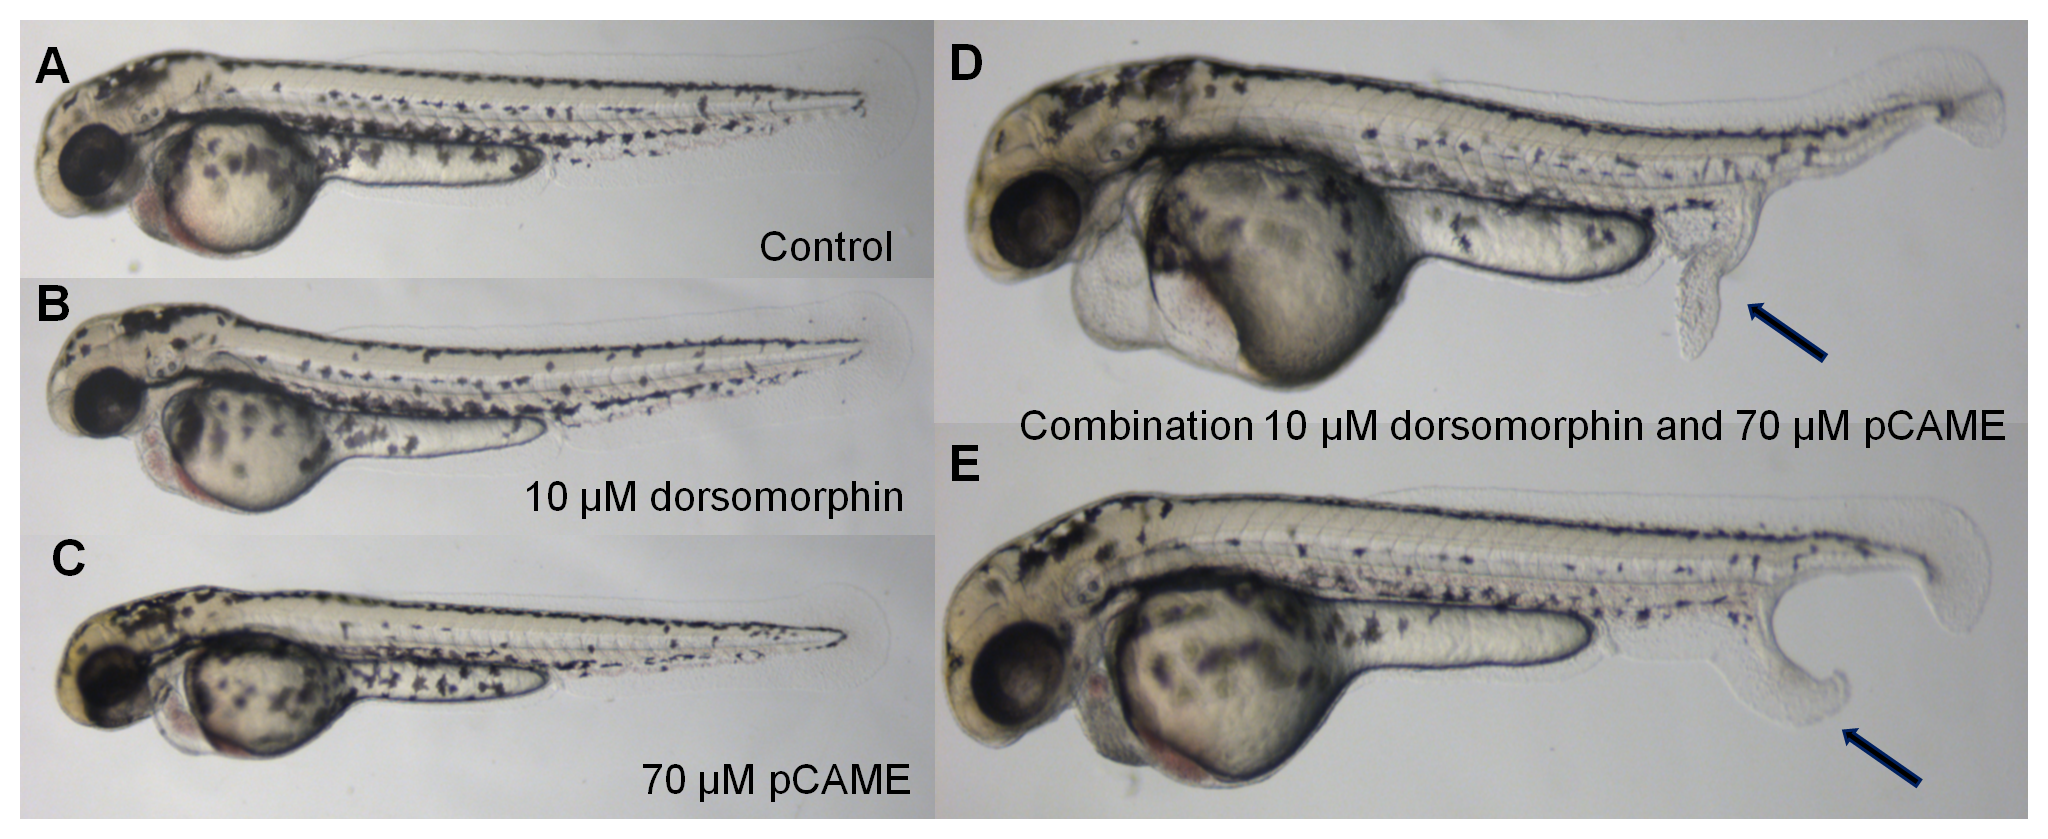
Fig. 4
Synergy between pCAME and dorsomorphin.
(A) Wild type pulsed with 1% DMSO in Danieau’s solution; (B) 10 µM dorsomorphin pulse; (C) 70 μM pCAME pulse; (D) and (E) Combination of 10 μM dorsomorphin and 70 μM pCAME pulse. Black arrows denote ectopic tails. All AB embryos are at 48 hpf and pulsed for 1h at tailbud stage. A significant increase of the percentage of ectopic tail formation was observed as well as a more pronounced phenotype.
Acknowledgments
This image is the copyrighted work of the attributed author or publisher, and
ZFIN has permission only to display this image to its users.
Additional permissions should be obtained from the applicable author or publisher of the image.
Full text @ PLoS One