
|
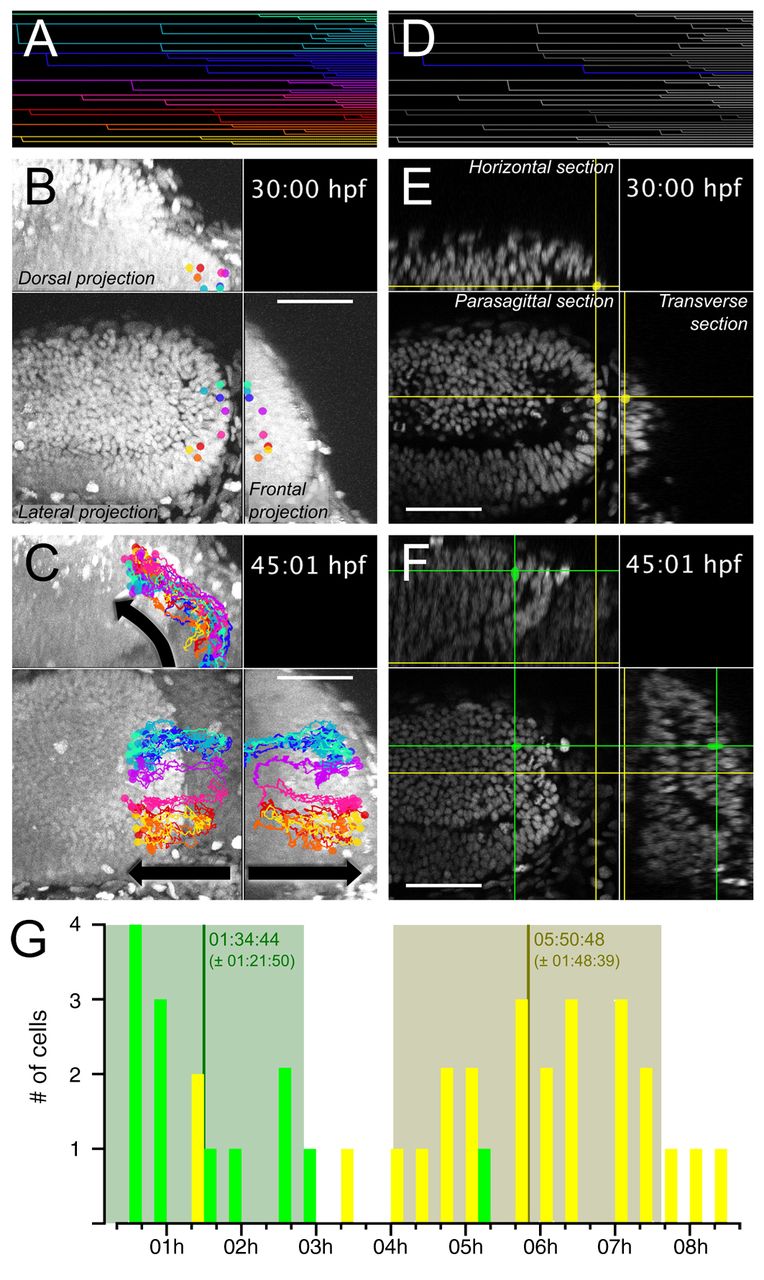
Fig. 3
Slow-amplifying PML cells give rise to tectal FAPs. PML cells were tracked from 30:00 hpf to 45:01 hpf. The complete lineage tree is shown in A. Cells originating from the PML at 30 hpf are found in the external part of the OT 15 hours later (B,C). In B and C, eight clonal cell trajectories, as indicated with different colours, have been overlaid on a volume projection of the left midbrain. The dots indicate the position of the cells at 30 hpf (B) and 45:01 hpf (C) and the lines trace the past trajectory of each clone. For the full movie, see supplementary material Movie 4. (D-F) A clone (represented by the intersection of the cross at the corresponding sagittal, horizontal and transverse planes) is followed from the PML, where it achieved two mitoses (E), to the OT, where two further mitoses occurred (F). For the full movie, see supplementary material Movie 5. (G) Cell cycle durations are separated into two clusters: OT (green) FAP cycles, 1:35±1:22 hours (n=13); PML (yellow) SAP cycles, 5:51±1:49 hours (n=25). Scale bars: 50 μm.