
|
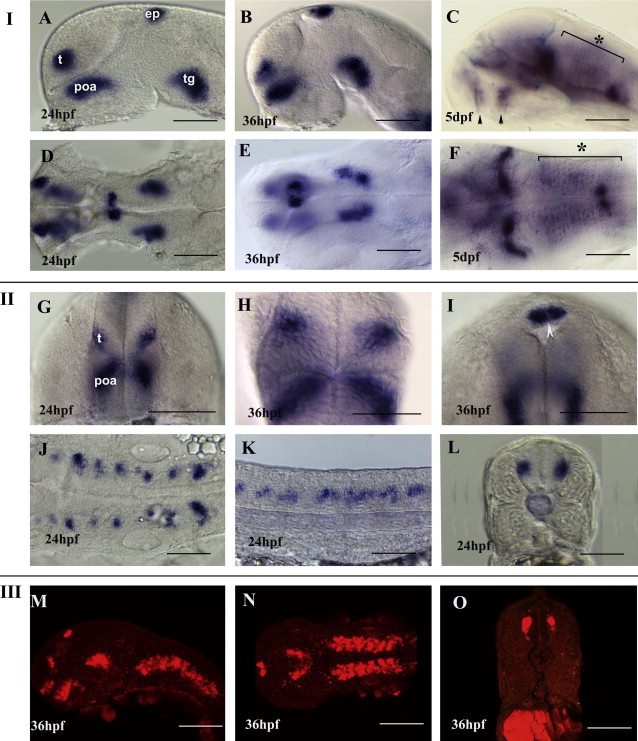
Fig. 3 Dynamic expression of nxph1 during zebrafish development. (I) Lateral (A–C) and dorsal (D–F) view of 24 hpf (A, D), 36 hpf (B, E) and 5 dpf (C, F) embryos showing nxph1 expression (blue). Black arrowhead indicates anterior and post-optic commissure and asterisk indicates hindbrain radial glia in C, F. Abbreviations: t, telencephalon; pOA, post-optic area; e; epiphysis; tg, tegmentum. (II) Transverse section showing nxph1 expression in telencephalon (t) and pre-optic area (poa) (G, H) at 24 hpf and 36 hpf. Transverse section through the diencephalon (I, white arrowhead indicates the pineal gland). Dorsal view of hindbrain (J), lateral view (K) and transverse section (L) of the spinal cord at 24 hpf. (III) Lateral (M) and dorsal (N) view of brain and transverse section of spinal cord (O) of nxph1 (red) at 36 hpf. Scale bar = 40 µm.
Reprinted from Gene expression patterns : GEP, 13(8), Thomas-Jinu, S., and Houart, C., Dynamic expression of neurexophilin1 during zebrafish embryonic development, 395-401, Copyright (2013) with permission from Elsevier. Full text @ Gene Expr. Patterns