
|
Fig. S2
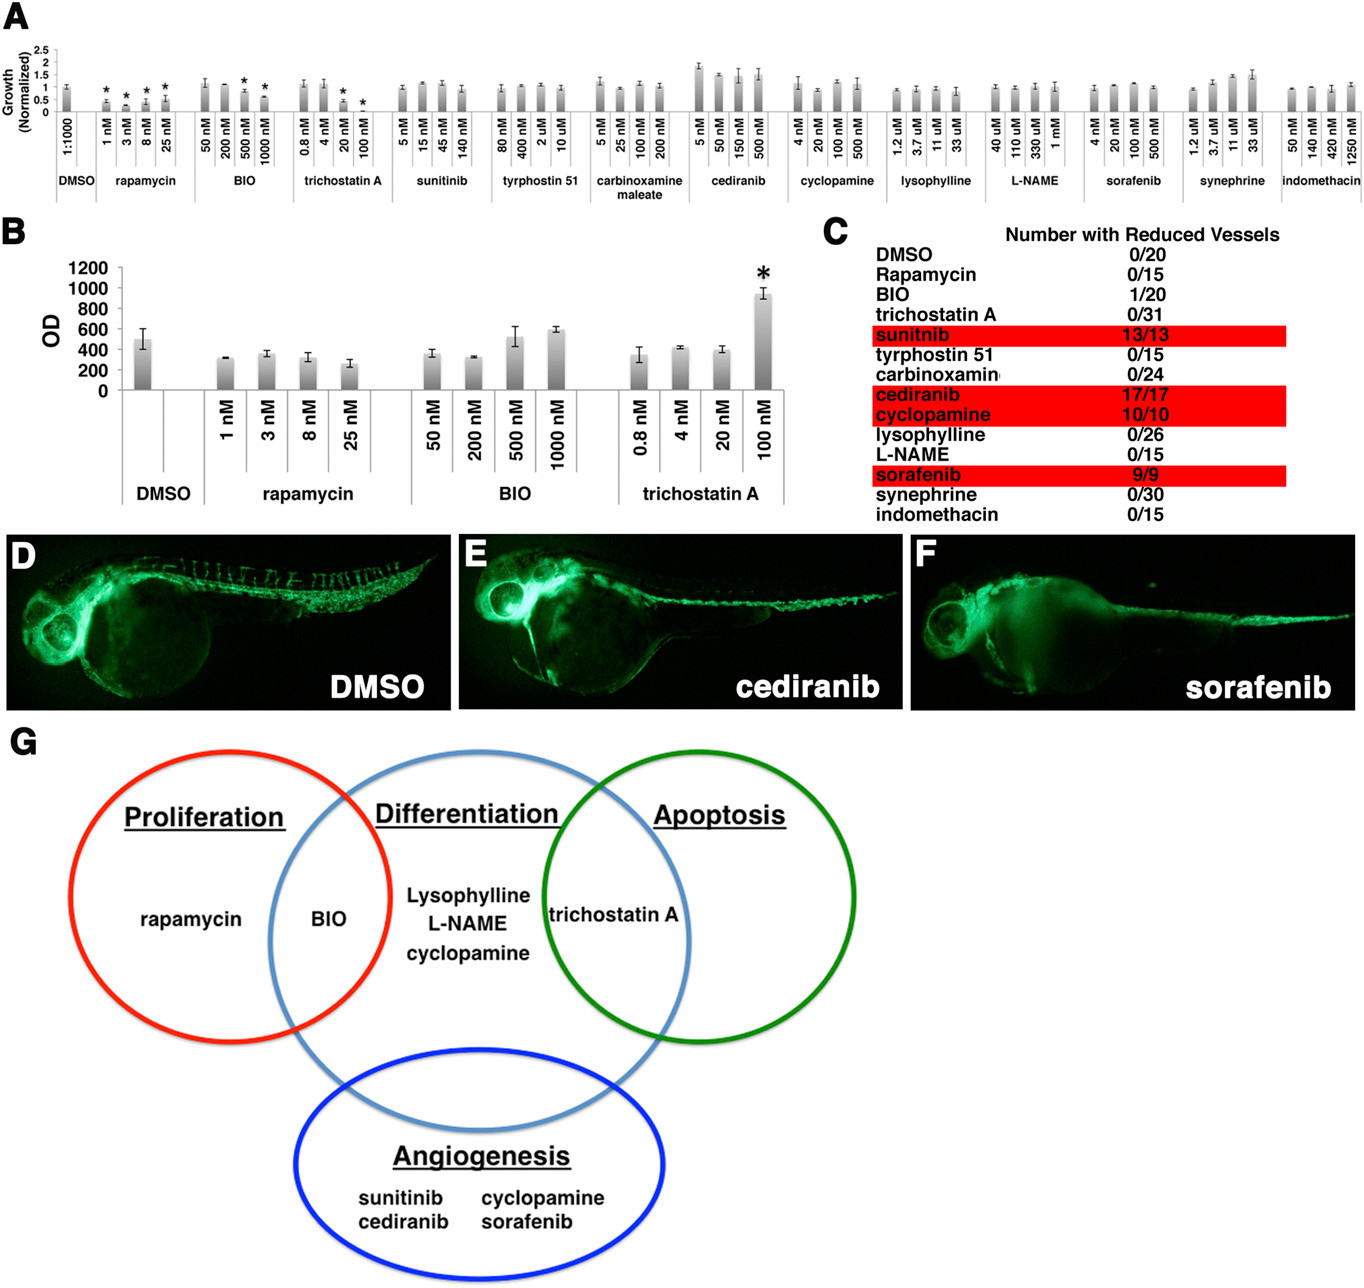
Lead compounds functionally alter cancer-specific processes. (A) RD cells were treated with lead compounds from the zebrafish secondary screen at four concentrations in the range of IC50. Cell growth/viability were assessed by cell titer glo after 4 d of drug treatment. Relative growth was normalized to cell numbers contained within each well at the beginning of the experiment. *Statistical significance with P < 0.05. (B) Lead compounds that affected growth (rapamycin, BIO, and trichostatin A) were further tested for their role in regulating apoptosis using a caspase glo assay. Average OD values from triplicate plating in an assay are shown. Each error bar denotes SD. *P value < 0.05, Student t test comparing test compound and DMSO. (C) Summary of angiogenesis assay. Tg(fli1:GFP embryos) were treated with DMSO and lead compounds (50 nM–10 μM) starting at early bud stage for 48 h. The effect of each compound on angiogenesis of intersegmental and tail vessels was assessed. Red indicates compounds that inhibit angiogenesis in fli1:GFP embryos. (D–F) Representative images of DMSO-treated (D), cediranib-treated (E), and sorafenib-treated (F) fli1:GFP embryos are shown. (G) Venn diagram summarizing functional categories of lead compounds in ERMS tumorigenesis.