
|
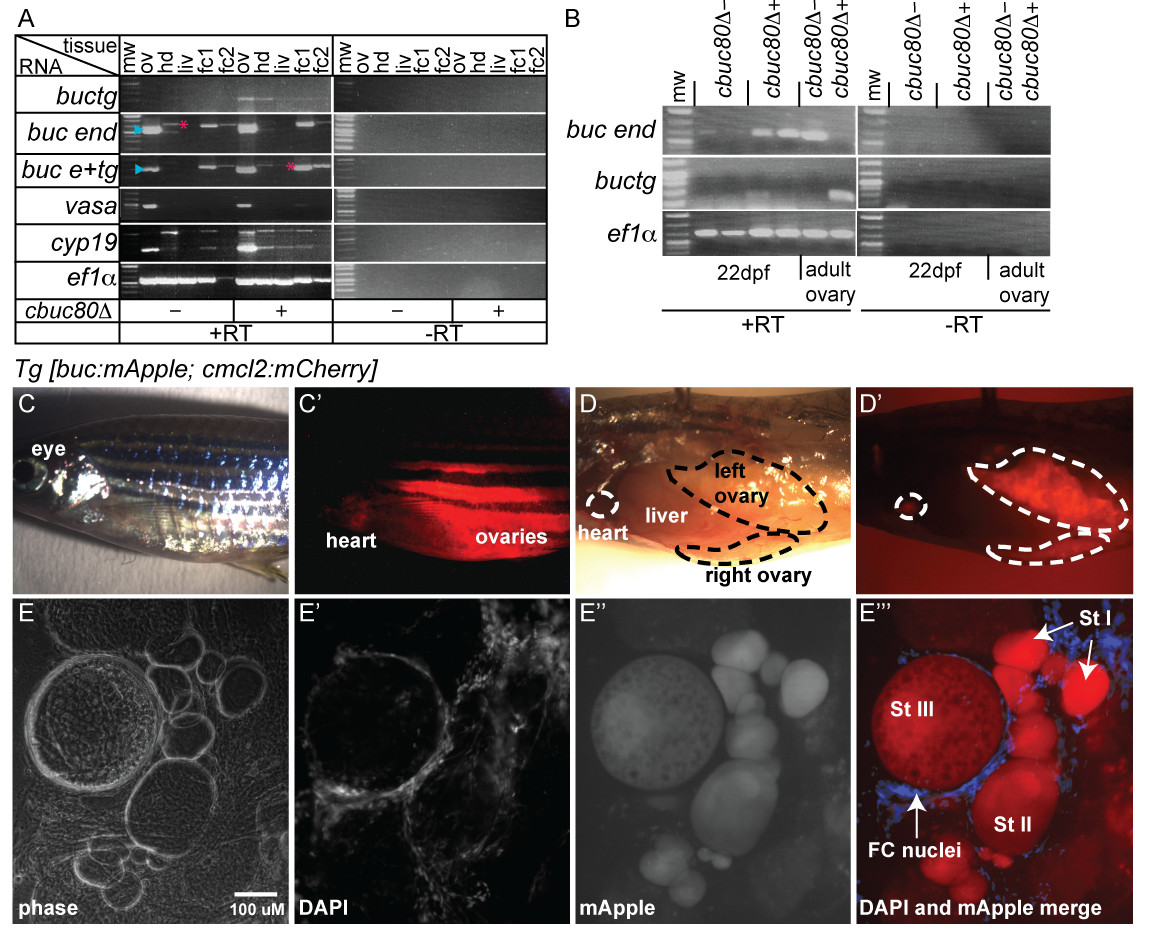
Fig. S1
bucky ball promoter drives expression in the germline and transgenic bucky ball transcripts show similar expression profiles to endogenous buc transcripts. A) Images of DNA gels show RTPCR products amplified from cDNA (+RT) produced from various tissues of cbuc80 transgene negative (cbuc80-) and positive (cbuc80+) F1 females. –RT indicates negative control for genomic contamination. Molecular weight ladder (mw), ovary (ov), head (hd), liver (liv), follicle cell (fc). buctg primers amplify transgenic transcripts, buc end primers amplify only endogenous buc, buc e+tg primers amplify both endogenous and transgenic transcripts. Aqua arrowhead indicates buc and pink asterisks indicate a nonspecific band amplified in some tissues (both were verified by sequencing). B) Images of DNA gels show RTPCR products amplified from cDNA (+RT) produced from juvenile and adult ovary of transgene negative (cbuc80-) and positive (cbuc80+) F1 females. C-E′′′) Transgenic F1 female expressing mApple under the control of the buc promoter. C-C2) Red fluorescent proteins mCherry (heart) and mApple (ovary) detected through the body wall. D-D2) In situ dissection of the Tg female revealed broad expression of mApple in early-stage oocytes throughout the ovaries. (E-E′′′) Whole-mount microscopy of dissected ovary demonstrates expression of buc promoter in early oocytes (stages I-III) (E′′-E′′′), but not in adjacent follicle cells (FC) labeled by DAPI (E2 and E′′′).