
|
Fig. S8
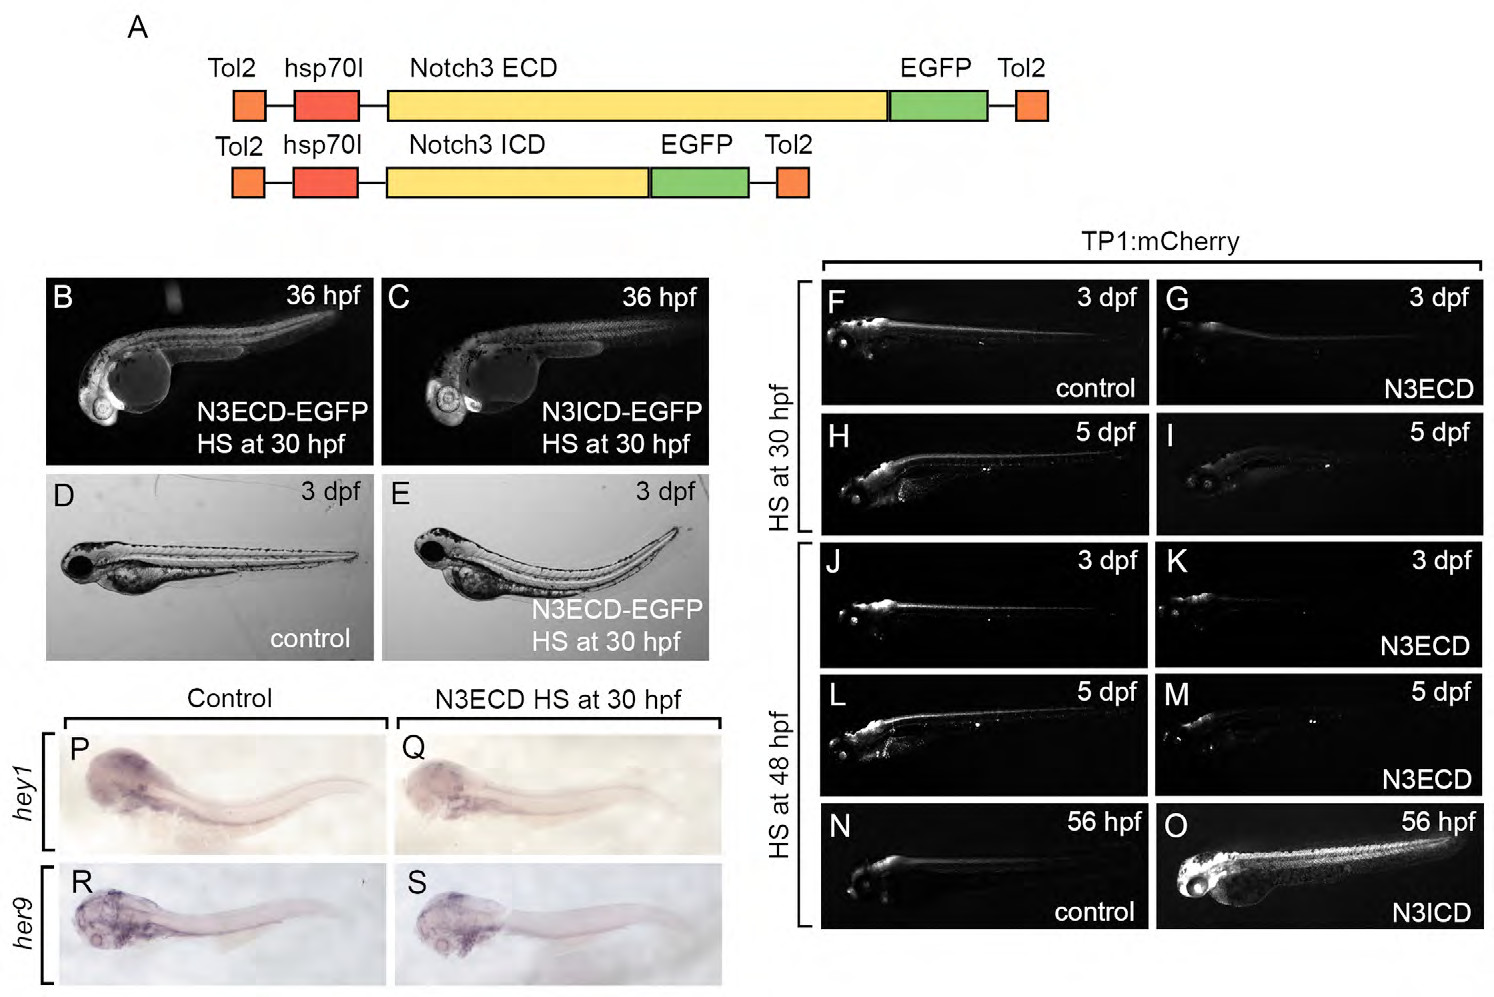
Organization and transgene expression for Tg(hsp70I:Notch3ECD-EGFP) and Tg(hsp70I:Notch3ICD-EGFP) transgenic constructs. (A) Diagram depicting the organization of Tg(hsp70I:Notch3ECD-EGFP) and Tg(hsp70I:Notch3ICD-EGFP) transgenic constructs. (B,C) Heat shock of Tg(hsp70I:Notch3ECD-EGFP) embryos (B) and Tg(hsp70I:Notch3CD-EGFP) embryos (C) at 30 hpf induced robust EGFP expression. (D,E) Heat shock of Tg(hsp70I:Notch3ECD-EGFP) embryos at 30 hpf resulted in trunk curvature at 3 dpf. (F-M) Heat shock of Tg(hsp70I:Notch3ECD-EGFP); Tg(Tp1bglob:hmgb1-mCherry) embryos at 48 hpf or 30 hpf caused significant reduction in mCherry intensity at 3 dpf and 5 dpf. (N,O) Heat shock of Tg(hsp70I:Notch3ICD-EGFP); Tg(Tp1bglob:hmgb1-mCherry) embryos at 48 hpf resulted in significantly increased mCherry fluorescent intensity at 56 hpf. (P-S) Tg(hsp70I:N3ECD-EGFP) larvae heat-shocked at 30 hpf showed reduced heyl and her9 expression compared to control group.