
|
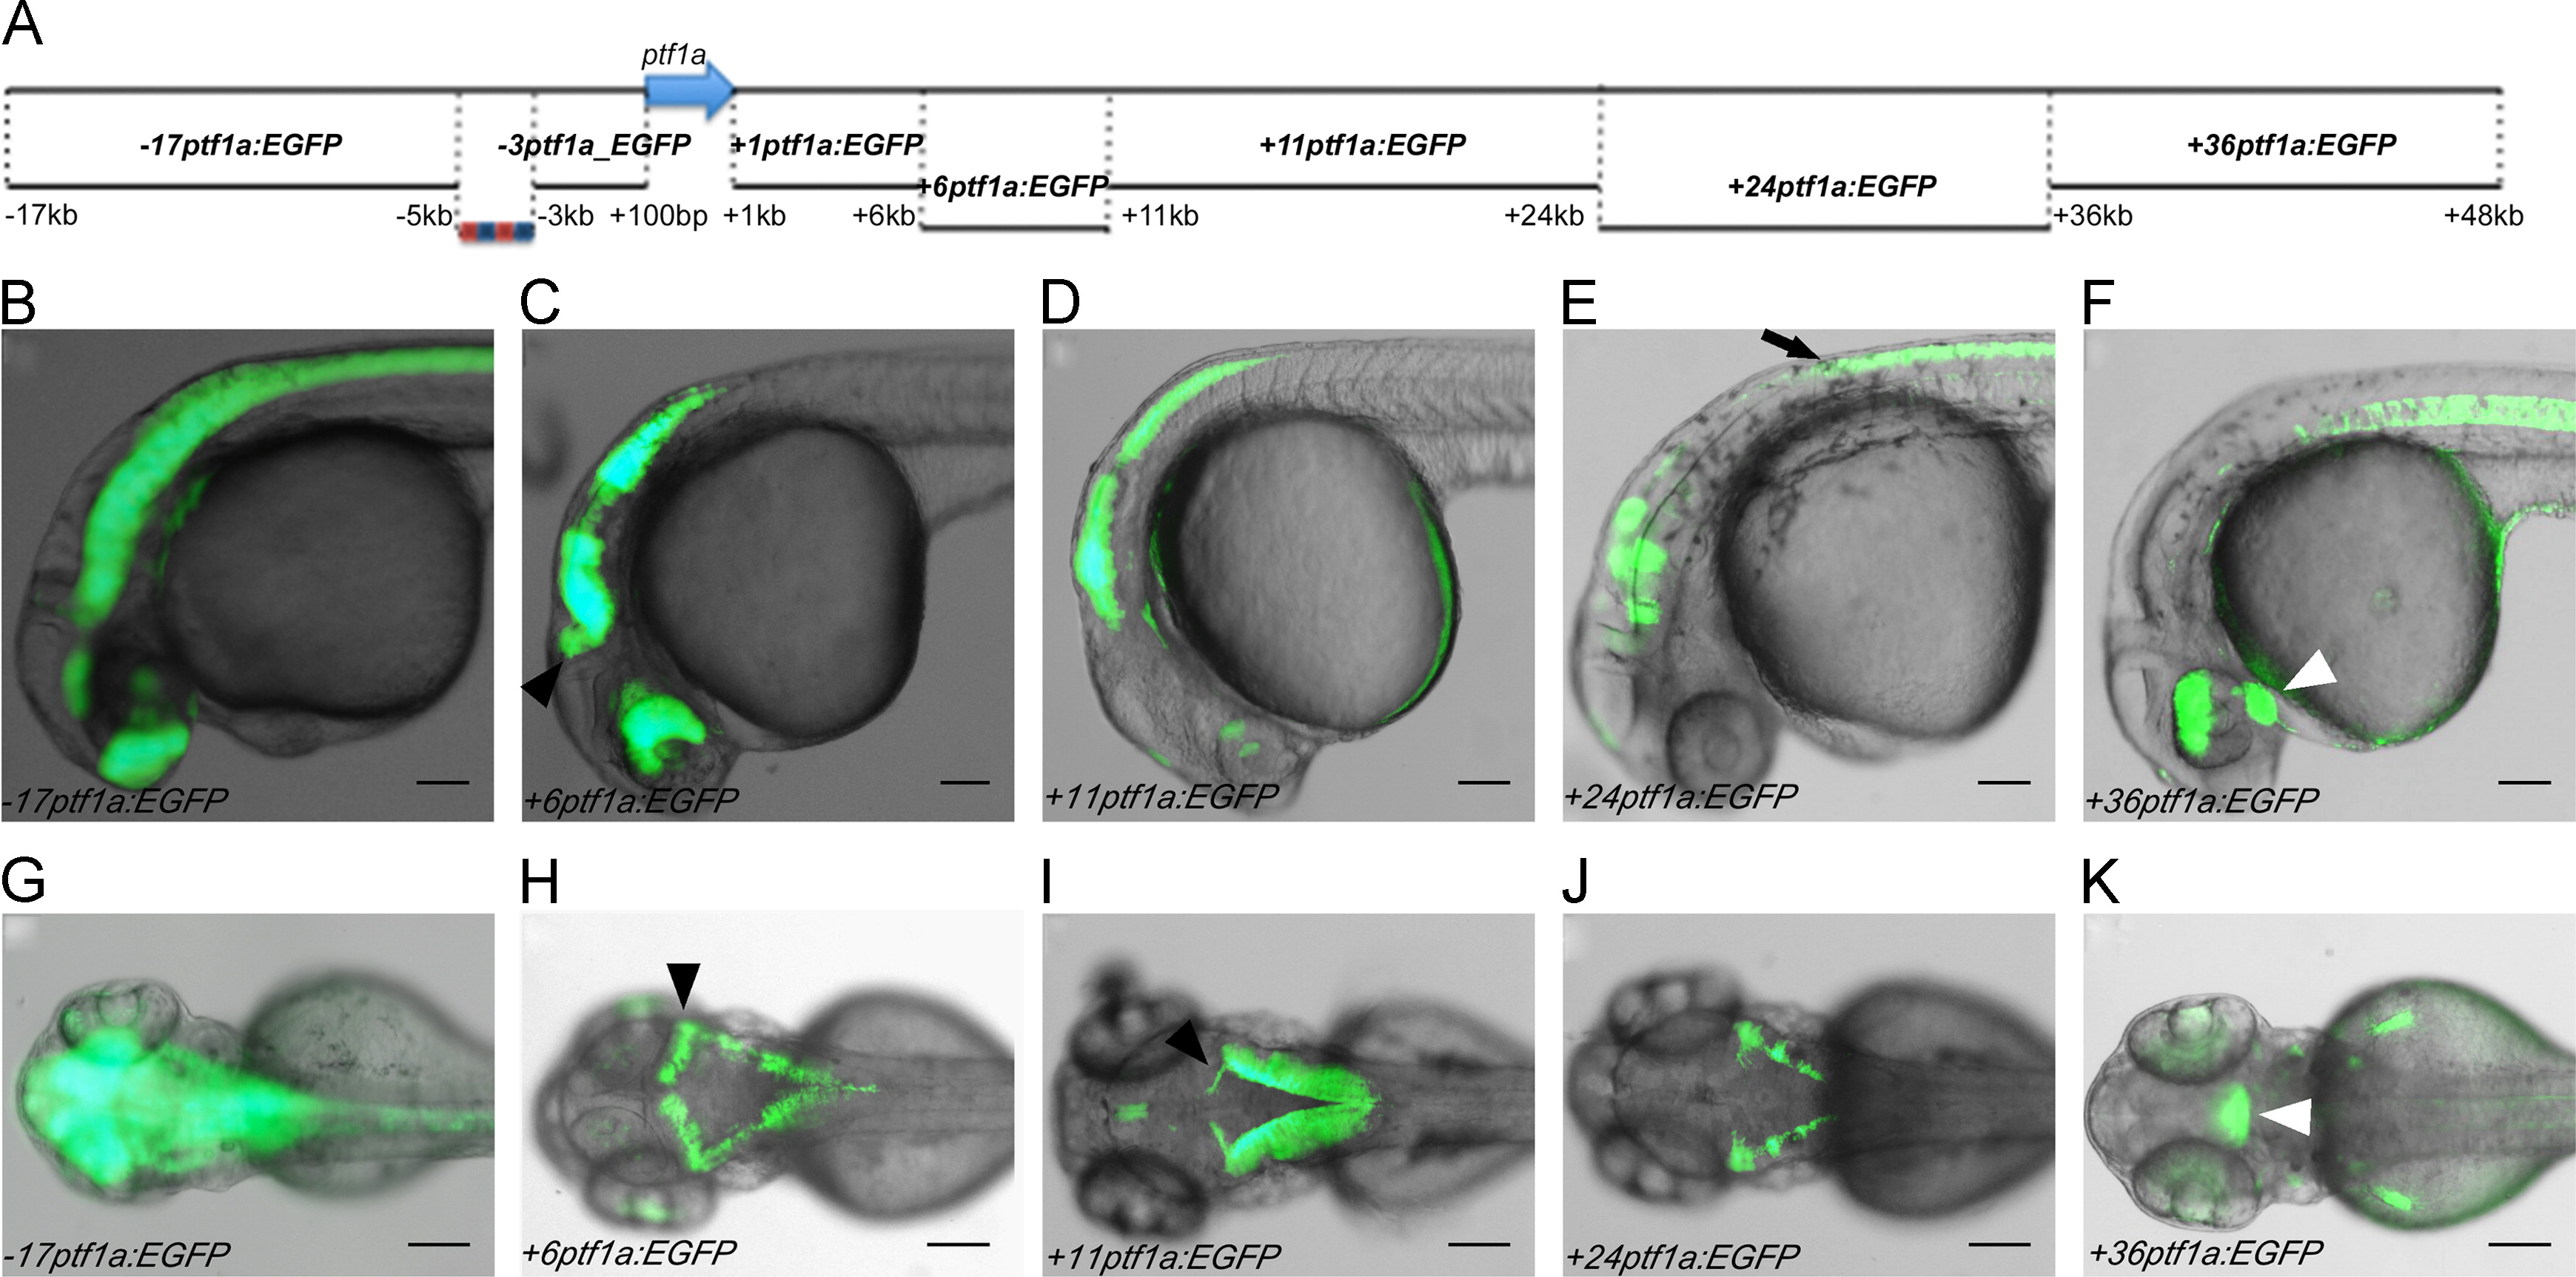
Fig. 2 Survey of ptf1a locus for regulatory activity. (A) The diagram indicates the non-coding sequences, ranging in size from 3 to13 kb and collectively spanning the region between 17 kb and +48 kb of the transcriptional start site of ptf1a, which were assayed for enhancer activity. The isolated sequences showed transcriptional activity at 1 dpf (B–F) and 3 dpf (G–K) in regions of the nervous system and retina overlapping endogenous ptf1a expression. The 17ptf1a element located upstream of the autoregulatory enhancer drives non-specific neuronal expression at 1 dpf (B) and 3 dpf (G). The +6ptf1a enhancer is active in the retina, cerebellum (black arrowhead), hindbrain and spinal cord at 1 dpf (C) and 3 dpf (H). The +11ptf1a enhancer is also active in the hindbrain, including the cerebellum (black arrowhead), the spinal cord and more weakly in the retina (D: 1 dpf, I: 3 dpf). The +24ptf1a element activates expression in certain rhombomeres of the hindbrain and in the spinal cord (black arrow) (E: 1 dpf, J: 3 dpf). The +36ptf1a element is active in the retina, hypothalamus (white arrowhead), fin buds and notochord (F: 1 dpf, K: 3 dpf). Scale bars: 200 μm.
Reprinted from Developmental Biology, 381(2), Pashos, E., Tae Park, J., Leach, S., and Fisher, S., Distinct enhancers of ptf1a mediate specification and expansion of ventral pancreas in zebrafish, 471-81, Copyright (2013) with permission from Elsevier. Full text @ Dev. Biol.