
|
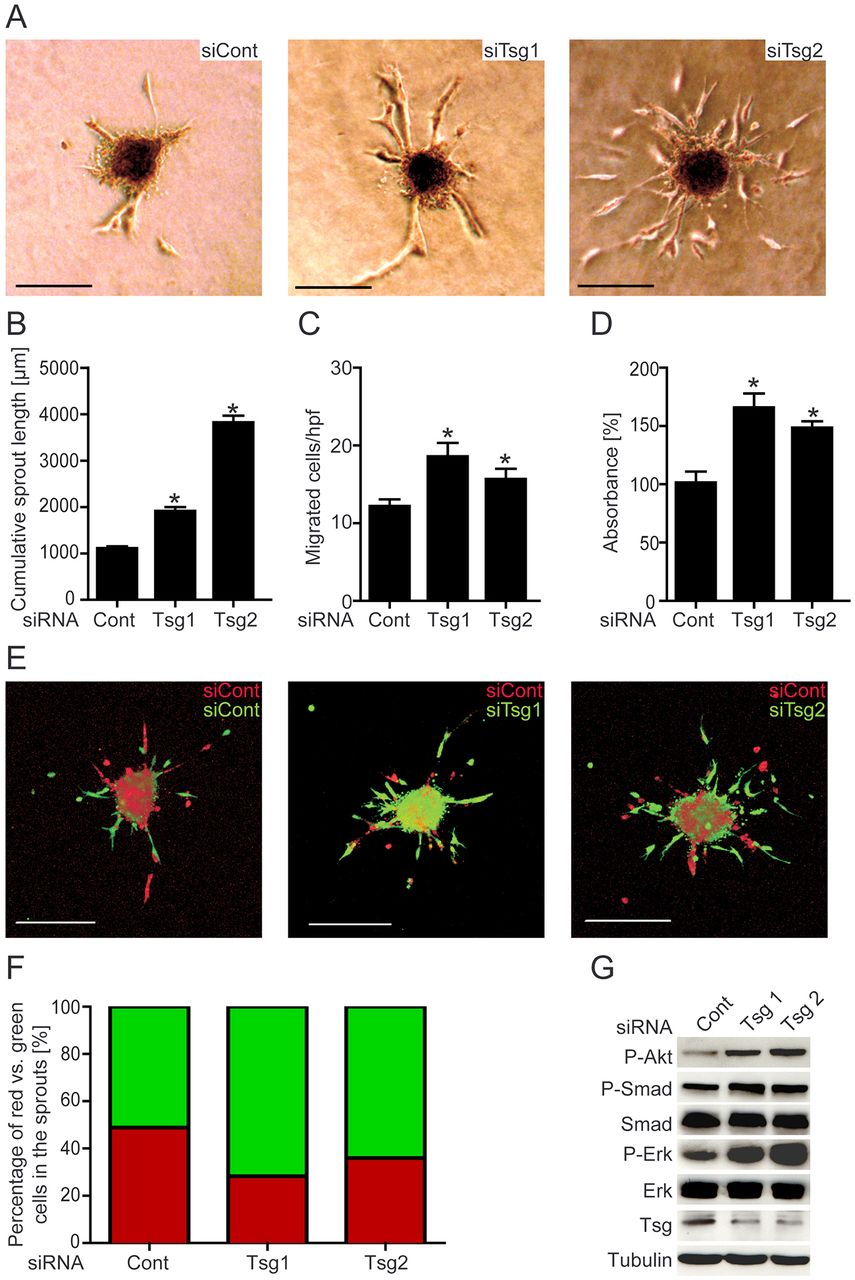
Fig. 7
Inhibition of Tsg in endothelial cells enhanced sprouting and signalling pathway activation. HUVECs were silenced for Tsg with either of two specific siRNAs or transfected with scrambled siRNA as control. (A,B) Six hours after siRNA transfection a collagen gel spheroid sprouting assay was performed. (A) Representative siRNA-transfected spheroids. Scale bars: 200μm. (B) Quantitative analysis of cumulative sprout length of spheroids. Values are means ± s.e.m.; n = 3; *P<0.001 versus siRNA control. (C) Migration was quantified 48hours post-transfection of HUVECs. Values are means ± s.e.m.; n = 3; *P<0.05 versus siRNA control. (D) Proliferation was determined by a BrdU assay. HUVECs were transfected in triplicate with the indicated siRNAs. 48hours post-transfection BrdU ELISA was performed. Values are means ± s.e.m.; n = 3; *P<0.001 versus siRNA control. (E) Mosaic spheroids were generated by mixing equal amounts of HUVECs transfected with either siRNA control and labelled with CMPTX (red) or siRNA targeted against Tsg (or control) and labelled with CFDA-SE (green). Confocal laser microscopy revealed equally mixed green and red sprouts under control conditions, whereas in partially Tsg-silenced spheroids, Tsg-silenced cells predominantly formed sprouts. Scale bars: 200μm. (F) Quantification of mosaic spheroids. (G) 48hours after siRNA transfection cells were lysed and subjected to western blot analysis, performed with the indicated antibodies.