
|
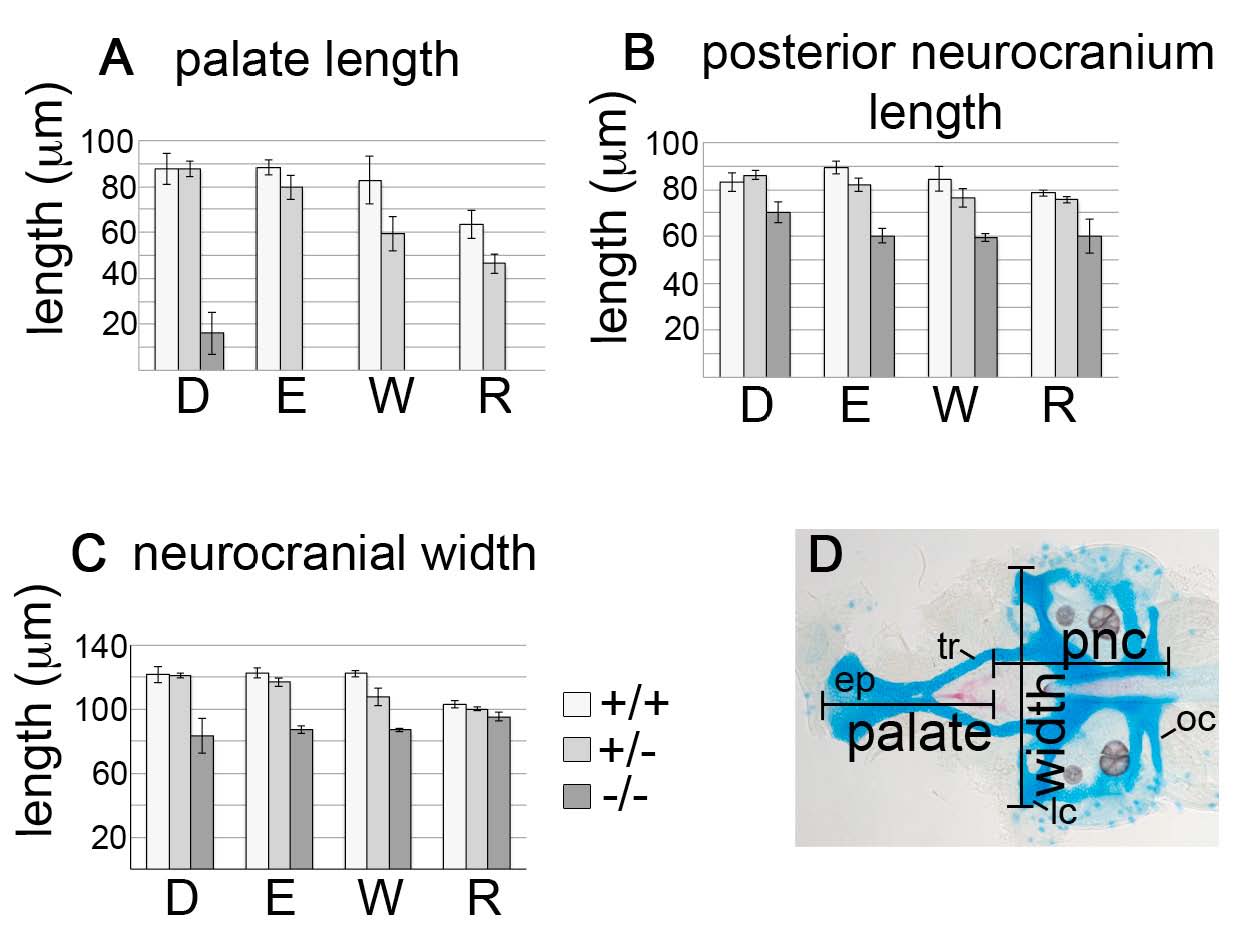
Fig. S12
Both wortmannin- and rapamycin-treated pdgfra mutants show a decrease in overall neurocranial length and width. (A-C) Embryos were treated from 10-24 hpf with either DMSO, 1.0% ethanol, 1.5 μM wortmannin or 3 μM rapamycin. Inhibition of either PI3K or mTOR phenocopies the effects of ethanol. Graphs depict the average (A) palate length, (B) posterior neurocranial length and (C) neurocranial width in μm (standard error bars are 1.5 s.e.m., non-overlapping bars indicate significance; Moses, 1987). Wild-type, light bar; pdgfra heterozygote, light-gray bar; mutant, dark-gray bar. (D) An Alcian Blue- and Alizarin Red-stained 5 dpf untreated wild-type neurocranium. Palate length was measured from the most anterior part of the ethmoid plate (ep) to the ends of the trabeculae (tr). The posterior neurocranium was measured from the most posterior part of the occipital arches (oc) to the ends of the trabeculae (tr). Neurocranial width was measured between the most lateral edges of the lateral commissures (lc). D, DMSO; E, ethanol; W, wortmannin, R, rapamycin.