
|
Fig. S3
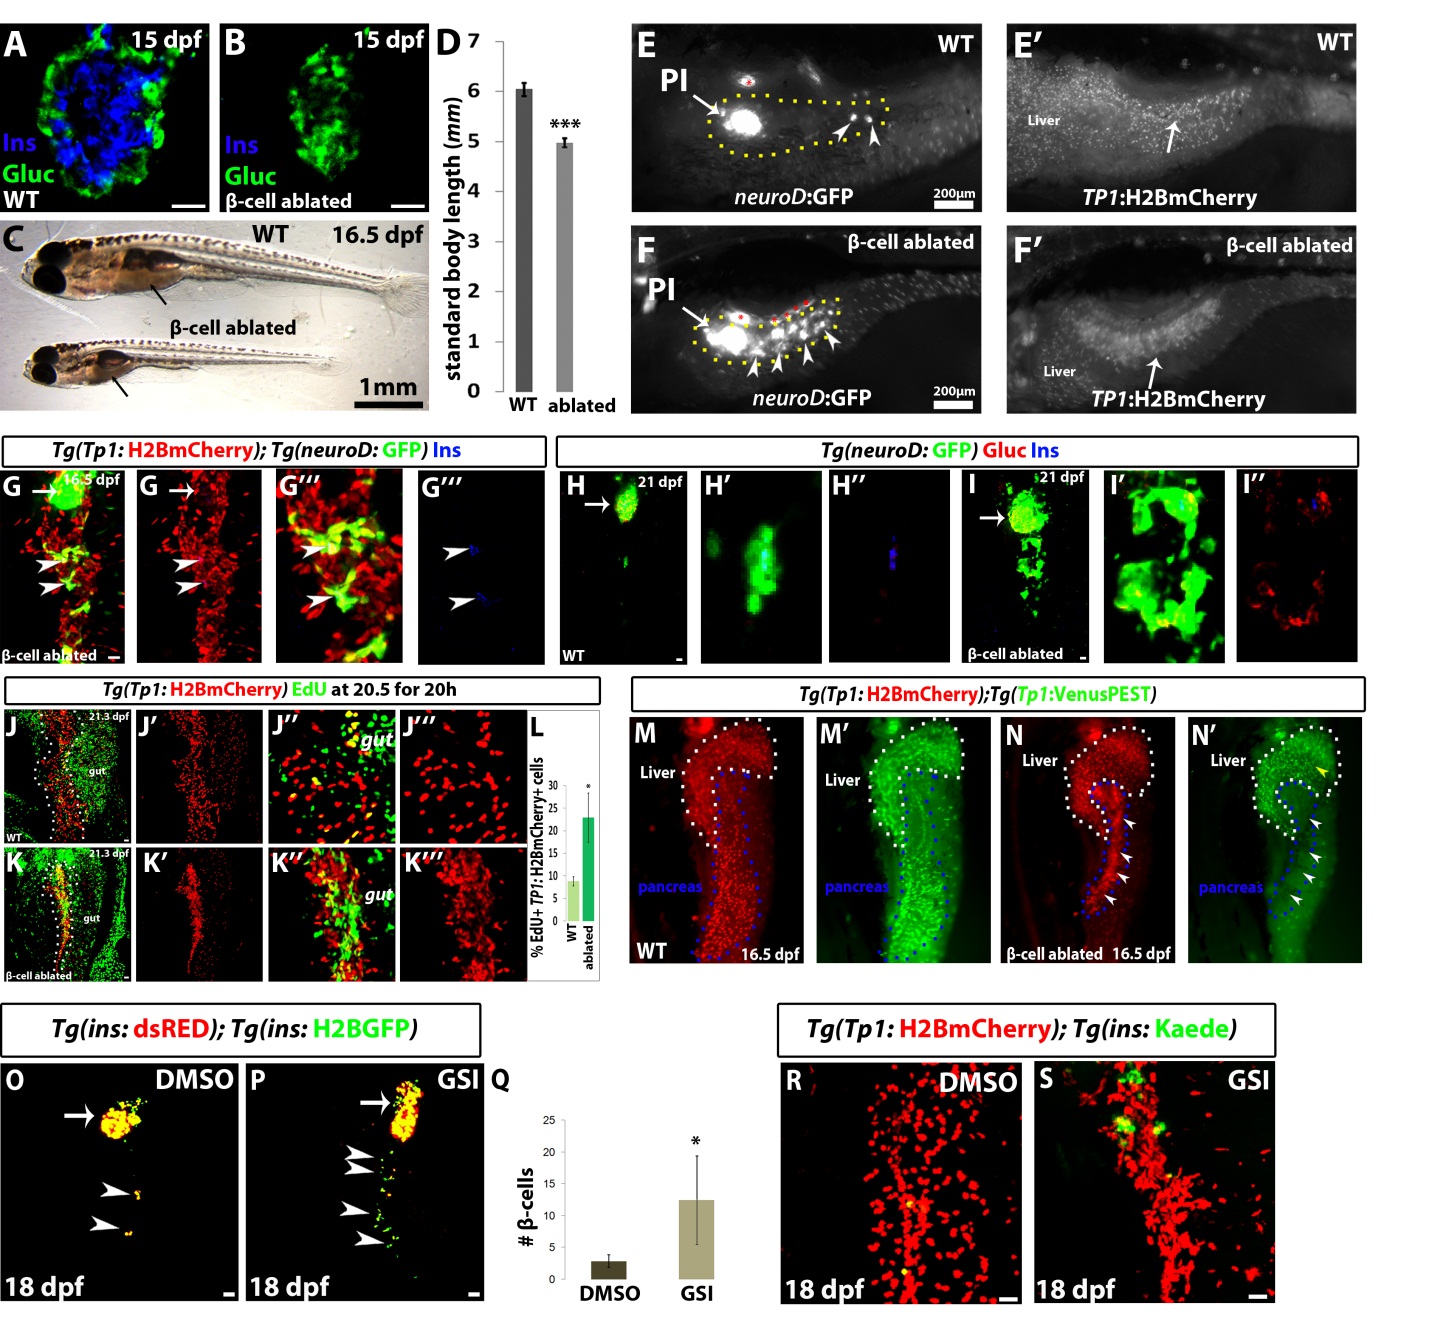
β Cell Deficiency during the Stage of External Nutrition Remodels the IPD and Activates Endocrine Progenitors; This Process Can Also Be Stimulated by Notch Signaling Downregulation in WT Animals, Related to Figure 3
(A and B) Conditional ablation of β-cells is achieved by Tg(ins:Cre) mediated excision of the BFP cassette from the floxed ins:loxp:BFPloxp:DTA transgene.
(A) In WT animals, the α-cells form a ring around the β-cells in the PI (15dpf).
(B) In β-cell ablated animals, the β-cells are absent and α-cells occupy their space in the PI (15dpf).
(C) 16.5dpf animals with the genotypes Tg(TP1:H2BmCherry);Tg(neuroD:GFP);Tg(ins:CRE) and Tg(ins:loxp:BFPloxp:DTA)+ or Tg(ins:loxp:BFPloxp:DTA)- were imaged live under bright field and fluorescence; subsequently the animals were fixed and stained for Insulin in order to identify the WT and β-cell ablated individuals.
(C) Micrograph of a WT (top) and a β-cell ablated (bottom) animal. β-cell ablated animals show a pronounced growth defect. Note the presence of food in the intestinal tract of both WT and β-cell ablated animals (arrows).
(D) Quantification of standard body length [1] at 16.5dpf. WT animals were 6.04 mm in length (± 0.7mm, n=29 animals) and β-cell ablated animals were 4.98 mm (± 0.51 mm, n=31 animals) (p<0.0001). Error bars = s.e.m.
(E and F) Fluorescence micrographs of the pair of animals shown in C. The pancreas is outlined by a dashed line in E and F. Tg(neuroD:GFP) expression marks all endocrine cells and their direct progenitors. The WT animal (E) exhibits two SIs (arrowheads) whereas the β-cell ablated animal (F) has formed multiple SIs in its pancreatic tail. Red asterisks indicate reflection of fluorescence from the inflated swim-bladder. Arrows in E′ and F′ point to the IPD marked by Tg(TP1:H2BmCherry) expression. Note the severe defects in IPD organization in F′ compared to E′. (G) Confocal micrographs of a β-cell ablated animal at 16.5dpf. The animal exhibits two Insulin+ cells (arrowheads). These Insulin+ cells and a majority of the Tg(neuroD:GFP)+ cells are also Tg(TP1:H2BmCherry)+, indicating that they differentiated from pancreatic NRCs. Arrow points to the PI.
(H and I) WT (H) and β-cell ablated (I) animals stained for Glucagon and Insulin at 21dpf. Tg(neuroD:GFP) expression marks all endocrine cells and their direct progenitors. Some ectopic Tg(neuroD:GFP)+ cells in the β-cell ablated animal (I) exhibit Glucagon immunoreactivity (see higher magnification panels). Arrows point to the PI.
(J and K) 20.5dpf WT (J) and β-cell ablated (K) animals were incubated in EdU for 20h, in order to reveal replicating cells. The pancreas is outlined by a dashed line. J,J′,K, and K′ are projections of the stack. J′′,J′′′,K′′, and K′′′ show high magnification single 8 planes. The animals were identified using Insulin immunoreactivity (not shown). The NRCs in the β-cell ablated animals exhibit a high rate of proliferation compared to WT.
(L) Quantification of the proportion of EdU+ NRCs. In WT animals, 8.8% of the NRCs were EdU+ (n=9 animals) whereas in β-cell ablated animals which exhibited clustering of the NRCs, 22.9% were EdU+ (n=9 animals) (p=0.01467). Error bars = s.d.
(M and N) Tg(TP1:H2BmCherry);Tg(TP1:VenusPEST);Tg(ins:CRE) and Tg(ins:loxp:BFPloxp:DTA)+ or Tg(ins:loxp:BFPloxp:DTA)- animals were imaged live under bright field and fluorescence, and subsequently fixed and stained for Insulin in order to identify the WT and β-cell ablated individuals. The WT animal (M) exhibits active Notch signaling in its liver (white dashed line) and pancreas (blue dashed line) whereas the β-cell ablated animal (N) exhibits active Notch signaling in its liver but not pancreas, indicating that the loss of Notch signaling is specific to the IPD. Note the excessive clustering and morphological defects in the IPD of the β-cell ablated animal.
(O and P) Tg(ins:dsRED; ins:H2BGFP) animals were treated with DMSO (O) or 5μM GSI (LY411575) (P) from 15 to 18dpf. To reduce toxicity, during each day of the treatment period, the chemicals were removed for 8h, and the animals were fed a highcalorie diet in fresh water. Under this treatment, more β-cells (white arrowheads) differentiated in the pancreatic tail of GSI-treated animals compared to DMSO controls, indicating that the downregulation of Notch signaling can induce the differentiation of mature endocrine cells during late larval stages.
(Q) Quantification of the average number of β-cells posterior to the PI (n=6 animals for DMSO controls; 5 for GSI-treated animals) (p=0.0367). Error bars = s.d. (R and S) Confocal micrographs of Tg(TP1:H2BmCherry);Tg(ins:Kaede) animals. In addition to ectopic β-cell differentiation, GSI-treatment (S) caused clustering and morphological defects in the IPD compared to DMSO controls (R). C,E and F are lateral views, anterior to the left, dorsal to the top. All other panels show lateral views, anterior to the top, dorsal to the left. Scale bars, 20 μm, except in C,E,F.