
|
Fig. 3
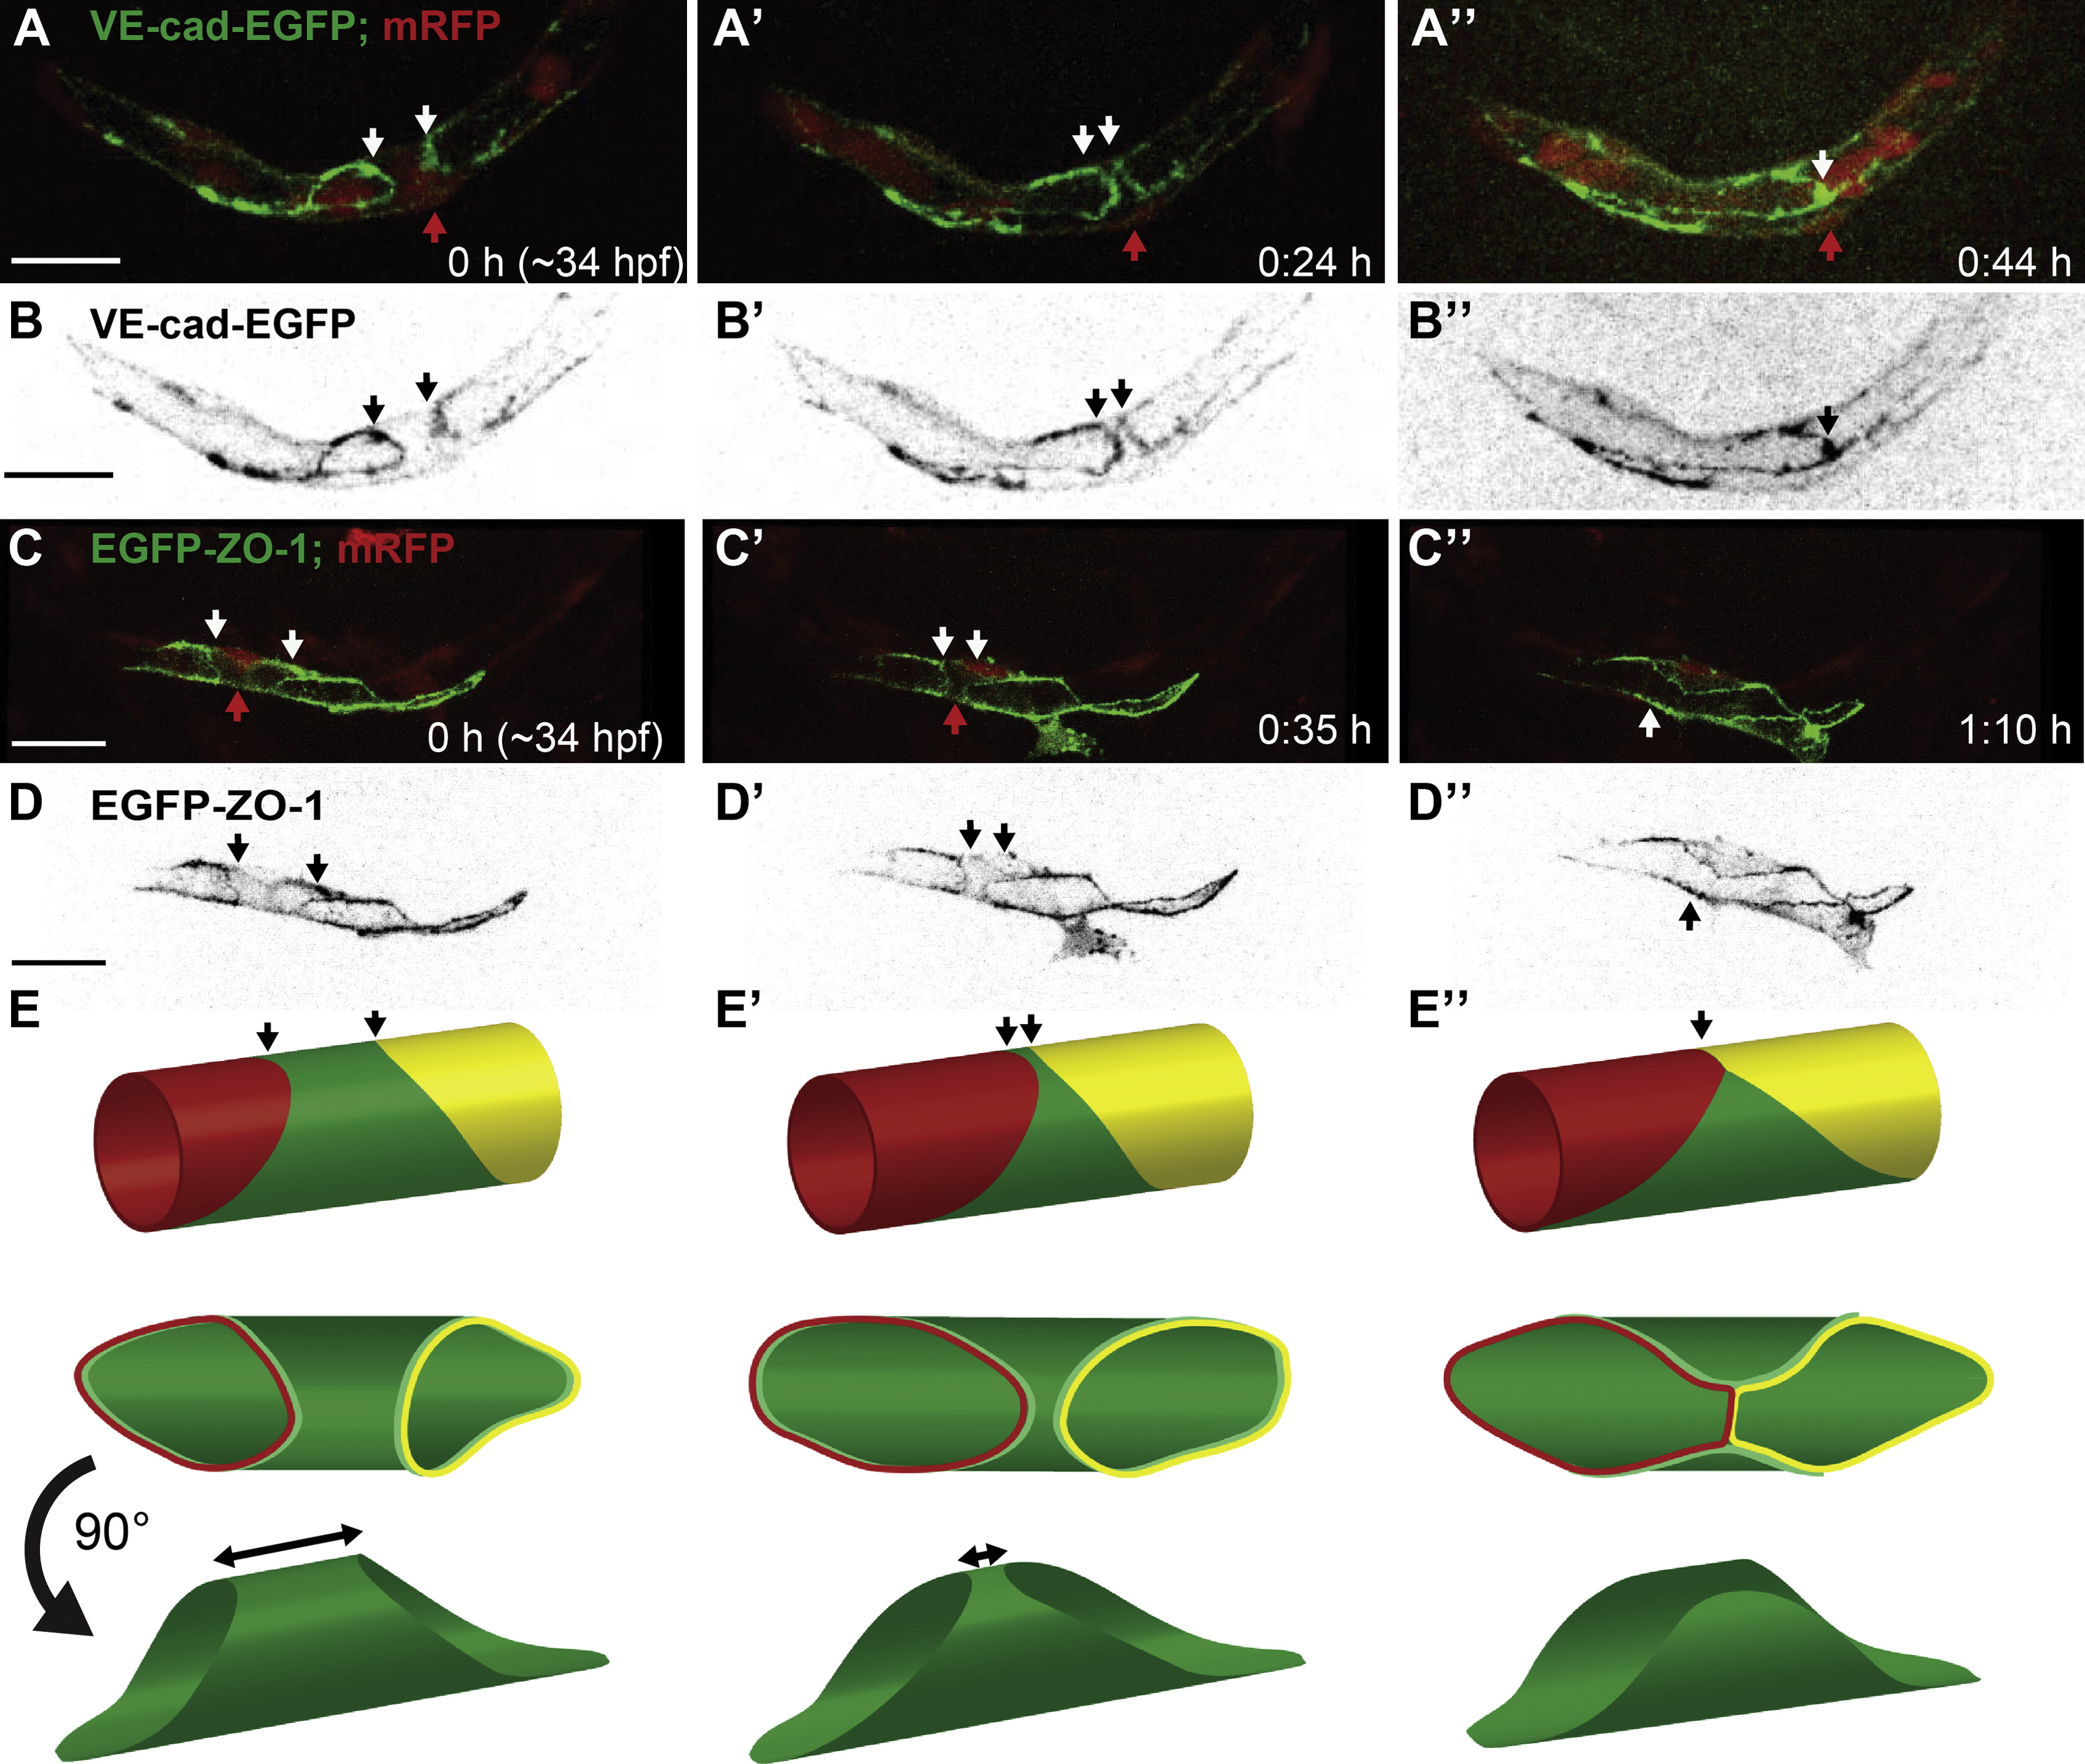
Formation of a Multicellular Tube through Cell Rearrangements (A and B) Still pictures of a time-lapse movie showing PLA formation in a transgenic embryo Tg(fliep:GFF)ubs3,(UAS:mRFP),(UAS:VE-cadherinΔC-EGFP)ubs12. Cell-cell junctions are marked in green and cell cytoplasm in red. One of the cells is a unicellular tube (A, red arrow) connected to the neighboring cells by ring shaped junctions (A and B, white/black arrows). A blood cell is visible within the lumen. With time the junctional rings move closer together meaning the neighboring cells migrate toward each other (A2, white arrows). Finally the rings meet making a new connection visible as a line of junctions (A3, white arrow). At this time point several blood cells go through the vessel. (B) shows VE-cadherin-EGFP alone (black). (C and D) Still pictures of a time-lapse movie showing cell rearrangements in a transgenic embryo Tg(fliep:GFF) ubs3,(UAS:mRFP),(UAS:EGFP-ZO-1)ubs5. The images show time points corresponding to (A), with only a single cell marked with EGFP-ZO-1 (C, green; D, black) and the endothelial cell cytoplasm in red. The cell (C, red arrow) is connected to the neighboring cells by ring shaped junctions. The cell body narrows on one side of the tube as the junctional rings move closer together (white arrows point the narrowing cell side). Finally, the cell splits on one side changing from unicellular tube into a flat cell, a part of the multicellular tube with one continuous junctional ring (white arrow). (E) A cellular model of unicellular to multicellular tube transformation. The middle cell (green) is initially a unicellular tube (E). The neighboring cells (red, yellow) move closer together making the green cell narrow on one side of the tube (E2). Finally the green cell splits on one side of the tube to allow the red and yellow cells to meet and establish a new connection (E3, arrow). Scale bars, 20 μm. See also Figure S2 and Movies S2 and S4.
Reprinted from Developmental Cell, 25(5), Lenard, A., Ellertsdottir, E., Herwig, L., Krudewig, A., Sauteur, L., Belting, H.G., and Affolter, M., In Vivo analysis reveals a highly stereotypic morphogenetic pathway of vascular anastomosis, 492-506, Copyright (2013) with permission from Elsevier. Full text @ Dev. Cell