
|
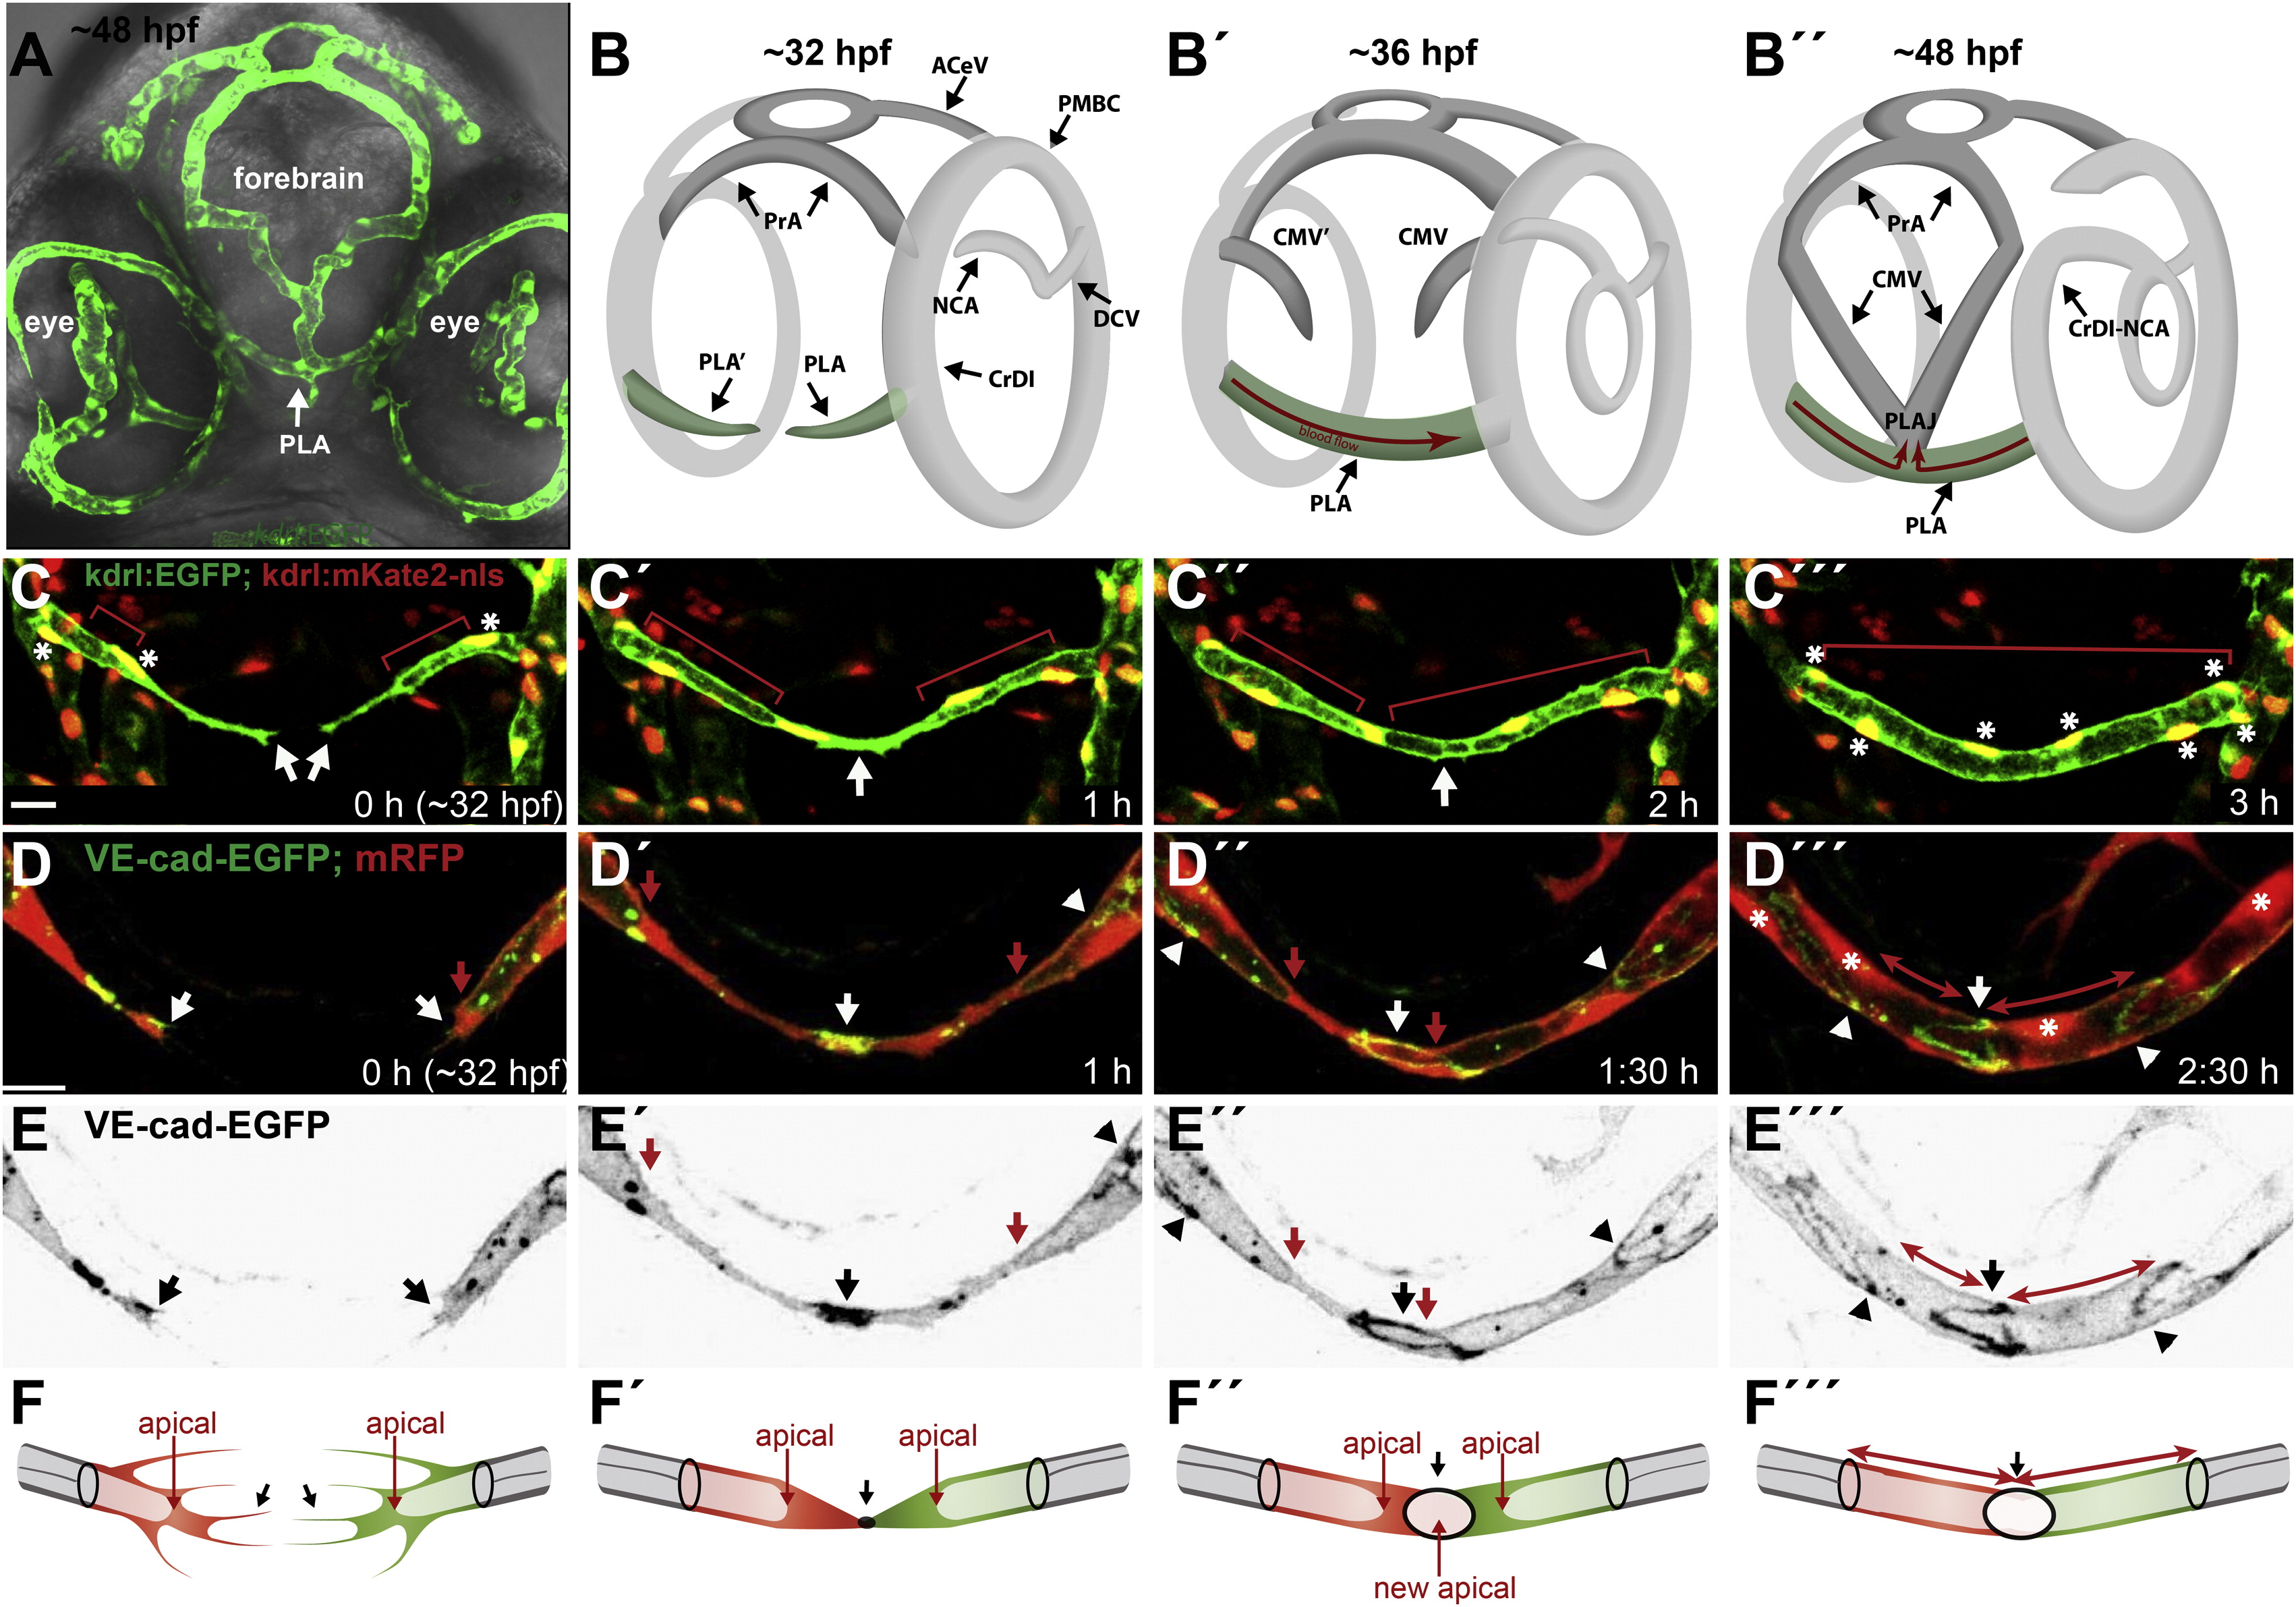
Fig. 1
Palatocerebral Artery Forms through Fusion of Two Lumenized Angiogenic Sprouts (A) Front view of a zebrafish Tg(kdrl:EGFP)s843 embryo head at <48 hpf. Blood vessels (green) together with bright-field image show the location of PLA within the head tissue (arrow). (B) Schematic representation of PLA development (green) in the head vasculature from 32 to 48 hpf. PLA, palatocerebral artery; PLAJ, junction of the palatocerebral arteries; CrDI, cranial division of the internal carotid artery; DCV, dorsal ciliary vein; PrA, prosencephalic artery; PMBC, primordial midbrain channel; ACeV, anterior (rostral) cerebral vein; CMV, communicating vessel; NCA, nasal ciliary artery. (C) Still pictures of a time-lapse movie showing formation of the PLA in a transgenic embryo Tg(kdrl:EGFP)s843;(kdrl:mKate-nls)ubs13. Endothelial cell cytoplasm is green and the nuclei are yellow (*). The PLA sprouts (C, arrows) extend from the CrDI and grow toward each other. Red bars mark the lumen length. The sprouts contact each other and anastomose (white arrow) to form a lumenized vessel that consists of five to six cells. (D) Still pictures of a time-lapse movie showing the formation of the PLA in a transgenic embryo Tg(fliep:GFF)ubs3,(UAS:mRFP),(UAS:VE-cadherinΔC-EGFP)ubs12. Cell-cell junctions are shown in green and cell cytoplasm in red. PLA sprouts (D, white arrows) are led by single tip cells connected to the stalk by a ring-shaped junction (D2-D32, white arrowheads). Red arrows show the lumen margin in each sprout. Upon contact of the sprouts, a spot of VE-cadherin-EGFP appears (D2, white arrow). The spot elongates into a ring-shaped junction (D3, D32, white arrow), and lumen is pushed through the junction for vessel perfusion (D3 and D32 red arrows). An asterisk marks the endothelial nuclei. (E) VE-cadherin-EGFP only (black), corresponding to stills in (D). (F) A cellular model of PLA fusion. Time points correspond to the images shown above. Red and green cells are tip cells; stalk cells are gray. Black arrows show the sprouts (F) and the contact formation (F2-F32). Red arrows show the luminal/apical membrane (F-F3) or transcellular lumen (F32). See also Figure S1 and Movie S1. Scale bars, 20 μm.
Reprinted from Developmental Cell, 25(5), Lenard, A., Ellertsdottir, E., Herwig, L., Krudewig, A., Sauteur, L., Belting, H.G., and Affolter, M., In Vivo analysis reveals a highly stereotypic morphogenetic pathway of vascular anastomosis, 492-506, Copyright (2013) with permission from Elsevier. Full text @ Dev. Cell