
|
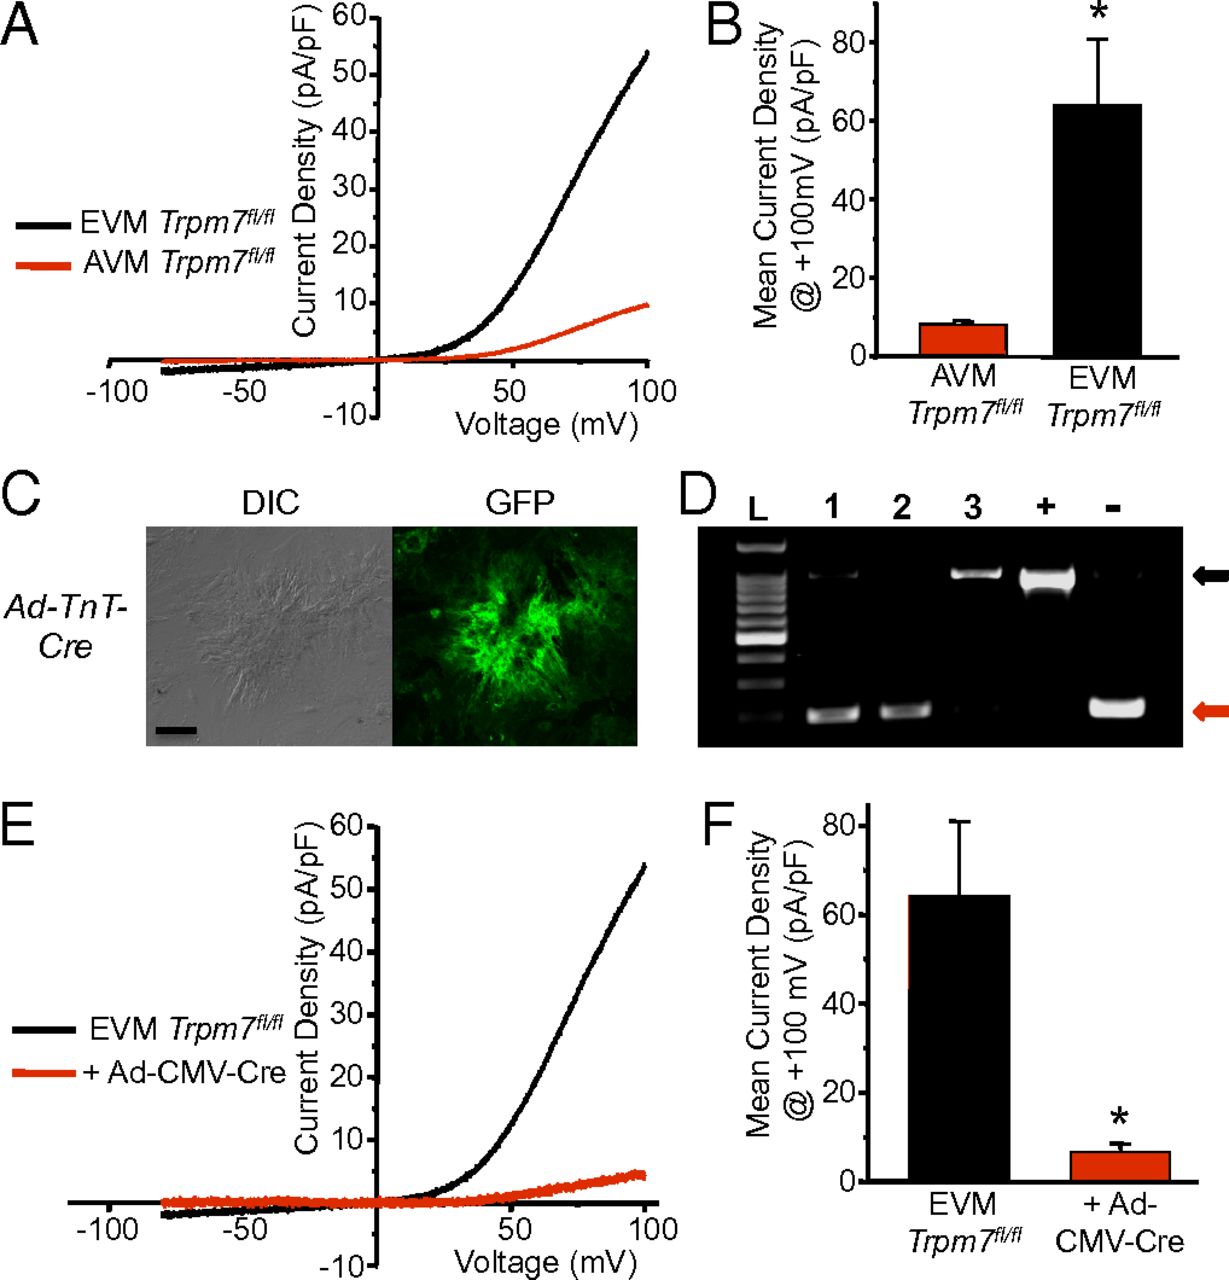
Fig. 1
TRPM7 current in cultured murine embryonic ventricular myocytes. (A) Representative TRPM7 current measured in cultured EVM compared with AVM after full run-up. (B) Mean TRPM7 current density at +100 mV in AVM (ITrpm7, AVM = 8.3 ± 0.9 pA/pF, n = 5) compared with EVM (ITrpm7, EVM = 64.2 ± 16.7 pA/pF, n = 5). (C) Interference contrast (DIC, Left) and fluorescence GFP image (Right). (D) PCR across exon 17 from genomic DNA isolated from Trpm7fl/fl EVM transduced with Ad-TnT-Cre (1), Ad-CMV-Cre (2), and Ad-CMV-Lacz (3), Trpm7fl/fl fibroblasts (+), and Trpm7fl/- tail (-). Black arrow, full-length exon 17. Red arrow, deleted exon 17. (E) Representative TRPM7 current measured in Trpm7fl/fl EVM and Trpm7fl/fl EVM 5 d after transduction with Ad-CMV-Cre. (F) Mean TRPM7 current density in Trpm7fl/fl EVM treated with Ad-CMV-Cre (n = 3) compared with untreated Trpm7fl/fl EVM (n = 5). *P < 0.05.