
|
Fig. S6
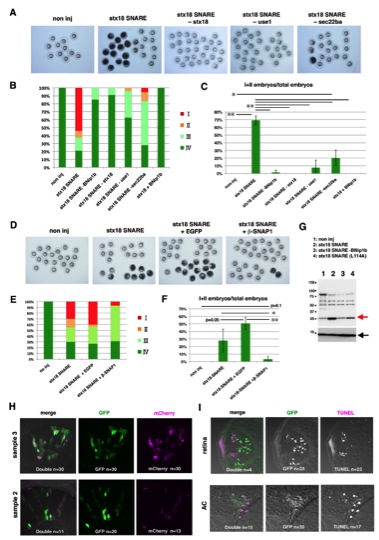
Injection experiments of a mixture of mRNAs and DNA constructs for syntaxin 18 SNARE components, related to Figure 5
(A) Eight hpf embryos injected with different combinations of mRNAs for syntaxin 18 SNARE components at 50 μg/mL each: non-injection, syntaxin 18 SNARE mixture, and syntaxin 18 SNARE mixture lacking either syntaxin 18, use1, or sec22ba. (B) Histogram of the percentage of 8 hpf embryos classified as class I-IV in the injection experiments shown in (A) and of a mixture of syntaxin 18 and bnip1b mRNAs. (C) Percentage of class I/II embryos. Green and black bars indicate the mean and standard deviation, respectively. *p<0.05. **p<0.01. (D) Eight hpf embryos injected with different combinations of mRNAs for syntaxin 18 SNARE components at 50 μg/mL each, EGFP at 200 µg/mL and β-SNAP1 at 200 μg/mL. (E) Histogram of the percentage of 8 hpf embryos classified as class I–IV in the injection experiments shown in (D). (F) Percentage of class I/II embryos. Green and black bars indicate the mean and standard deviation, respectively. *p<0.05. **p<0.01. The number of injection experiments shown in (C, F) and p-values from t-tests are shown in Table S2. (G) Western blotting of 7 hpf embryos injected with different combination of mRNAs for syntaxin 18 SNARE components using anti-BNip1b antibody. Stable protein expression of BNip1b (red arrow, lane 2) and BNip1b(L114A) (red arrow, lane 4) was confirmed. Histone H3 is a loading control detected on the same membrane (black arrow). (H) Confocal scanning of 48 hpf wild-type retinas injected with DNA constructs encoding atoh7:GFP (15 μg/mL) and atoh7:mCherry-BNip1a (2.5 μg/mL). In the upper case (sample 3 used in Table S3A), almost all cell express both GFP and mCherry-BNip1a. The percentage of the number of double-positive cells relative to the total number of GFP-expressing cells is 100 %. In the lower case (sample 2 used in Table S3A), the percentage the number of double-positive cells relative to the total number of GFP-expressing cells is 55%. These percentages were used for the estimation of the probability of co-expression of GFP and one of SNARE components (Pi). (I) High magnification images of Figure 5E. Upper and lower panels indicate RGCs at 72 hpf and ACs at 48 hpf, respectively. The percentage of concurrent expression of all four syntaxin 18 SNAREs in GFP-positive cells (Pc) is estimated as TUNEL-positive cell number/(TUNEL-positive cell number + GFP-positive cell number - double-positive cell number). As shown in Table S3B, Pc was 54.8 % for RGCs and 45.9 % for ACs.
Reprinted from Developmental Cell, 25(4), Nishiwaki, Y., Yoshizawa, A., Kojima, Y., Oguri, E., Nakamura, S., Suzuki, S., Yuasa-Kawada, J., Kinoshita-Kawada, M., Mochizuki, T., and Masai, I., The BH3-Only SNARE BNip1 Mediates Photoreceptor Apoptosis in Response to Vesicular Fusion Defects, 374-387, Copyright (2013) with permission from Elsevier. Full text @ Dev. Cell