
Image
|
Figure Caption
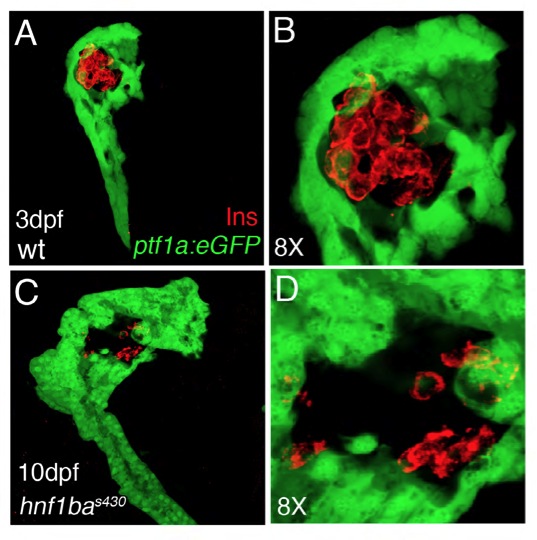
Fig. S2 Severe example of β-cell number reduction and disorganization in a hnf1bas430 mutant with mild exocrine hypoplasia. (A-D) Fluorescent confocal microscopy of Tg(ptf1a:eGFP)jh1 (green) 3 dpf wild-type (A,B) and 10 dpf hnf1bs430 mutant (C,D) pancreas stained for insulin to mark β-cells (red). 3D rendering showing an hnf1bas430 mutant at 10 dpf with a larger exocrine pancreas (C) than that of a wild type at 3 dpf (A). (B,D) Magnification (8×) of A and C showing that β-cells (red) remain both reduced and disorganized in hnf1bas430 mutants at 10 dpf.
Figure Data
Acknowledgments
This image is the copyrighted work of the attributed author or publisher, and
ZFIN has permission only to display this image to its users.
Additional permissions should be obtained from the applicable author or publisher of the image.
Full text @ Development