
|
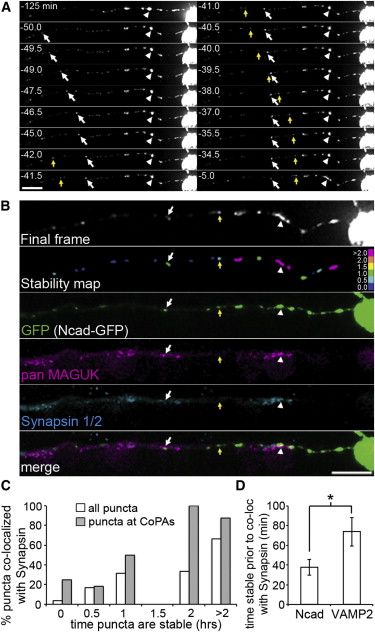
Fig. 6 N-Cadherin Recruitment Precedes Synapsin (A) Selected frames from a 2 hr time-lapse movie (from 24–26 hpf) of Ncad-GFP expression in a RB cell. Some puncta were paused for the entire imaging period (arrowhead), whereas others paused during imaging (arrow). Scale bar represents 10 μm.(B) Postimaging IF labeling demonstrates the presence of synapsin 1/2 (cyan) and MAGUKs (magenta) at an N-cadherin-GFP (green) punctum that was paused for the entire imaging period (arrowhead) and for 34.5 min preceding the end of imaging (arrow), but not at a punctum that was paused for only 29.5 min preceding the final frame (yellow arrow). A stability map (with bins as described in Figure 5) reports the time each puncta was paused preceding the end of imaging. Scale bar represents 10 μm.(C) A stability histogram quantifying the percentage of synapsin 1/2 puncta that colocalized with N-cadherin-GFP (white bars) reveals that recruitment of N-cadherin precedes synapsin by 37.6 min (±8.0 min). Gray bars show data for VAMP2-mKate2 from histogram in Figure 5C to emphasize the difference in the time delay with which synapsin colocalization is first seen. Bins were as described for Figure 5.(D) Histogram quantifying the average amount of time (in min.) NCad and VAMP2 puncta were stable prior to the end of imaging and colocalized with synapsin. n = 13 RB axon segments analyzed. Error bars show SEM. p < 0.05.