
|
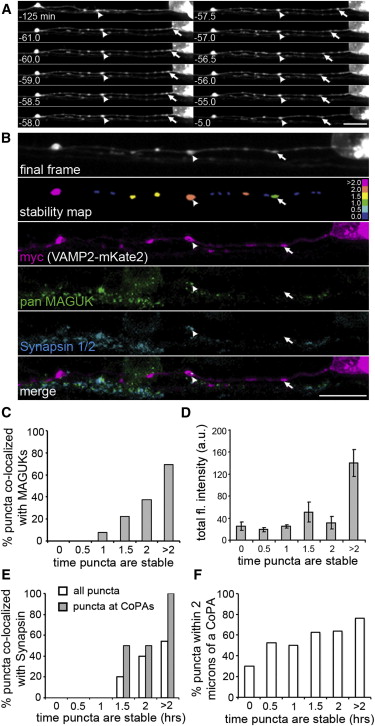
Fig. 5 Delayed Synapsin Recruitment to Paused VAMP2-mKate2 Puncta (A) Selected frames from a 2 hr time-lapse movie (from 24–26 hpf) of VAMP2-mKate2 expressed by a RB cell. Although some puncta remained stable for the entire imaging period (arrowheads) others stabilized during imaging (arrow). Scale bar represents 10 μm. (B) Postimaging IF labeling demonstrates the presence of MAGUKs (green) at a VAMP2-mKate2 punctum that was paused for at least 2 hr (arrowhead), but not at a punctum paused for 29 min (arrow). The stability map uses a color code to report the time each punctum was paused before the end of imaging. Bins were as follows: nonpaused puncta (0.0, dark blue), paused for 0–0.5 hr (0.5), 0.5–1 hr (1), etc. to puncta paused for the entire imaging period (>2.0, magenta). Scale bar represents 10 μm. (C) Stability histogram shows quantification of the percentage of VAMP2-mKate2 puncta colocalized with MAGUKs over the total of all axon segments analyzed. Bins are as described for the stability map above. n = 7 RB axon segments analyzed. (D) Intensity histogram shows the total fluorescence intensity for VAMP2 puncta. A significant increase in total fluorescence intensity was seen at puncta paused for >2 hr. Error bars show SEM. (E) A stability histogram quantifying the percentage of synapsin 1/2 that colocalized with VAMP2-mKate2 puncta reveals that, on average, recruitment of VAMP2-mKate2 preceded that of synapsin by 83.7 min (±12.5 min). n = 13 RB axon segments analyzed. (F) A stability histogram quantifying the percentage of VAMP2-mKate2 puncta that are localized within 2 μm of a CoPA cell.