
|
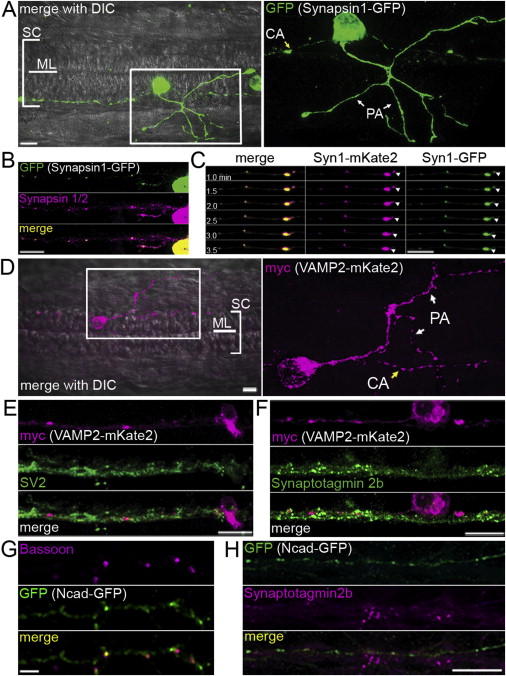
Fig. S2 Validation of Fluorescently-Tagged Fusion Constructs, Related to Figure 4 (A) synapsin1-GFP in a RB neuron in the zebrafish spinal cord at 25 hpf. Left panel: Dorsal view of IF labeling of GFP overlayed with a brightfield image. The midline (ML) and extent of the spinal cord (SC) are indicated. Rostral is to the left. Right panel: enlargement of IF outlined in box showing synapsin1-GFP. PA: peripheral arbor, CA: central axon. Scale bar, 10 μm. (B) synapsin1-GFP was localized with a similar distribution as endogenous synapsin 1/2 in RB axons in the zebrafish spinal cord. (C) Selected sequence of 6 frames, 30 s apart, from a 30 min movie. Arrowheads highlight a moving punctum labeled with both synapsin1-GFP and synapsin1-mKate2. (D) A RB neuron expressing VAMP2-mKate2 at 25 hpf in a dorsal view. Left panel, IF for VAMP2-mKate2 overlayed on a bright field image. Right panel, magnification of myc IF labeling, showing the peripheral arbor (PA) and central axon (CA) of the RB. Scale bar, 10 μm. (E) IF labeling of SV2 was highly colocalized with VAMP2-mKate2 labeling. Scale bar 10 μm. (F) IF labeling of STV marker synaptotagmin2b was highly colocalized with VAMP2-mKate2. Scale bar 10 μm. (G) IF for bassoon on Ncad-GFP transfected rat hippocampal neurons shows that the majority of Bassoon puncta colocalized with Ncad-GFP puncta. (H) IF for synaptotagmin2b colocalized with only a small percentage of Ncad-GFP puncta. Scale bar 10 μm.