
|
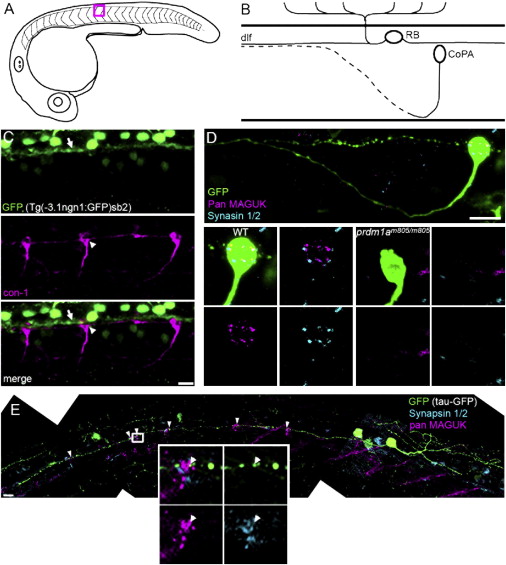
Fig. 1 RBs Synapse onto CoPA Interneurons (A) Diagram of a lateral view of a 25 hpf zebrafish embryo. Studies were performed between segments 11 and 15. Red box outlines segment 12, the region represented in (B). (B) Diagram depicting the cell body location and axon trajectories of an RB cell and a CoPA cell, in a lateral view of the developing spinal cord. The dotted axon represents a contralateral projection. (C) CoPA cell bodies (white arrowhead), labeled with con-1 antibody (magenta), were in close proximity to RB axons expressing GFP (white arrow), in ngn1:GFP transgenic embryos. Scale bar represents 10 μm. (D) pan MAGUK (magenta) and synapsin 1/2 (cyan) immunolabeling on WT and prdmm805/m805 embryos with Tau-GFP-labeled CoPA cells. Top panel: shows axon projections and cell body of a CoPA cell in WT embryo. The cell body is shown at higher magnification in bottom left 4 panels, to highlight overlap of pre and postsynaptic puncta. Lower right four panels: no pre- or postsynaptic puncta were seen on CoPA cell bodies in prdmm805/m805 embryos, lacking RB cells. Scale bar represents 10 μm. (E) Composite image of a RB cell expressing GFP (green), including the entire central axon extending rostrally, with labeling for synapsin 1/2 (cyan) and pan MAGUK (magenta). Distinct clusters of colocalized pan MAGUK and synapsin 1/2 immunofluorescence were at CoPA cell bodies, see arrowheads. Inset shows distinct MAGUK and synapsin 1/2 puncta, arrowhead indicates a MAGUK puncta adjacent to a synapsin 1/2 puncta that is within a varicosity in the GFP-expressing RB axon. Scale bar represents 10 μm. See also Movie S1.