
|
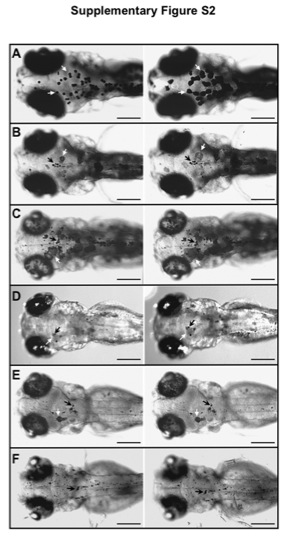
Fig. S2 Dark adaptation experiment in V-ATPase zebrafish mutants. Background adaptation was used as a qualitative assay to compare the physiological state of V-ATPase mutants at 5 dpf. (A) WT, (B) V0-d1, (C) V0-ac45b, (D) V1-E1b, (E) V1-H and (F) V0-ca. Larvae at the right panels are the same fish than the left panels, after 2 h of dark adaptation. Whereas WT, V1-d and V0-ac45b larvae (A – C) show a positive response by expanding melanocytes in the dark background, V1-E1b, V1-H and V0-ca fail to show any response. White arrows point at the same melanocyte cell before and after dark adaptation. In mutant fish there are as well spots of melanin that we consider fragments of cells (black arrows) these spots do not expand after the dark adaptation treatment. Because of the pigment dilution phenotype in V-ATPase mutants, melanocytes are paler than WT melanocytes. Images from before and after dark adaptation were taken under the same light conditions. Bar is 200 μm.