
|
Fig. 3
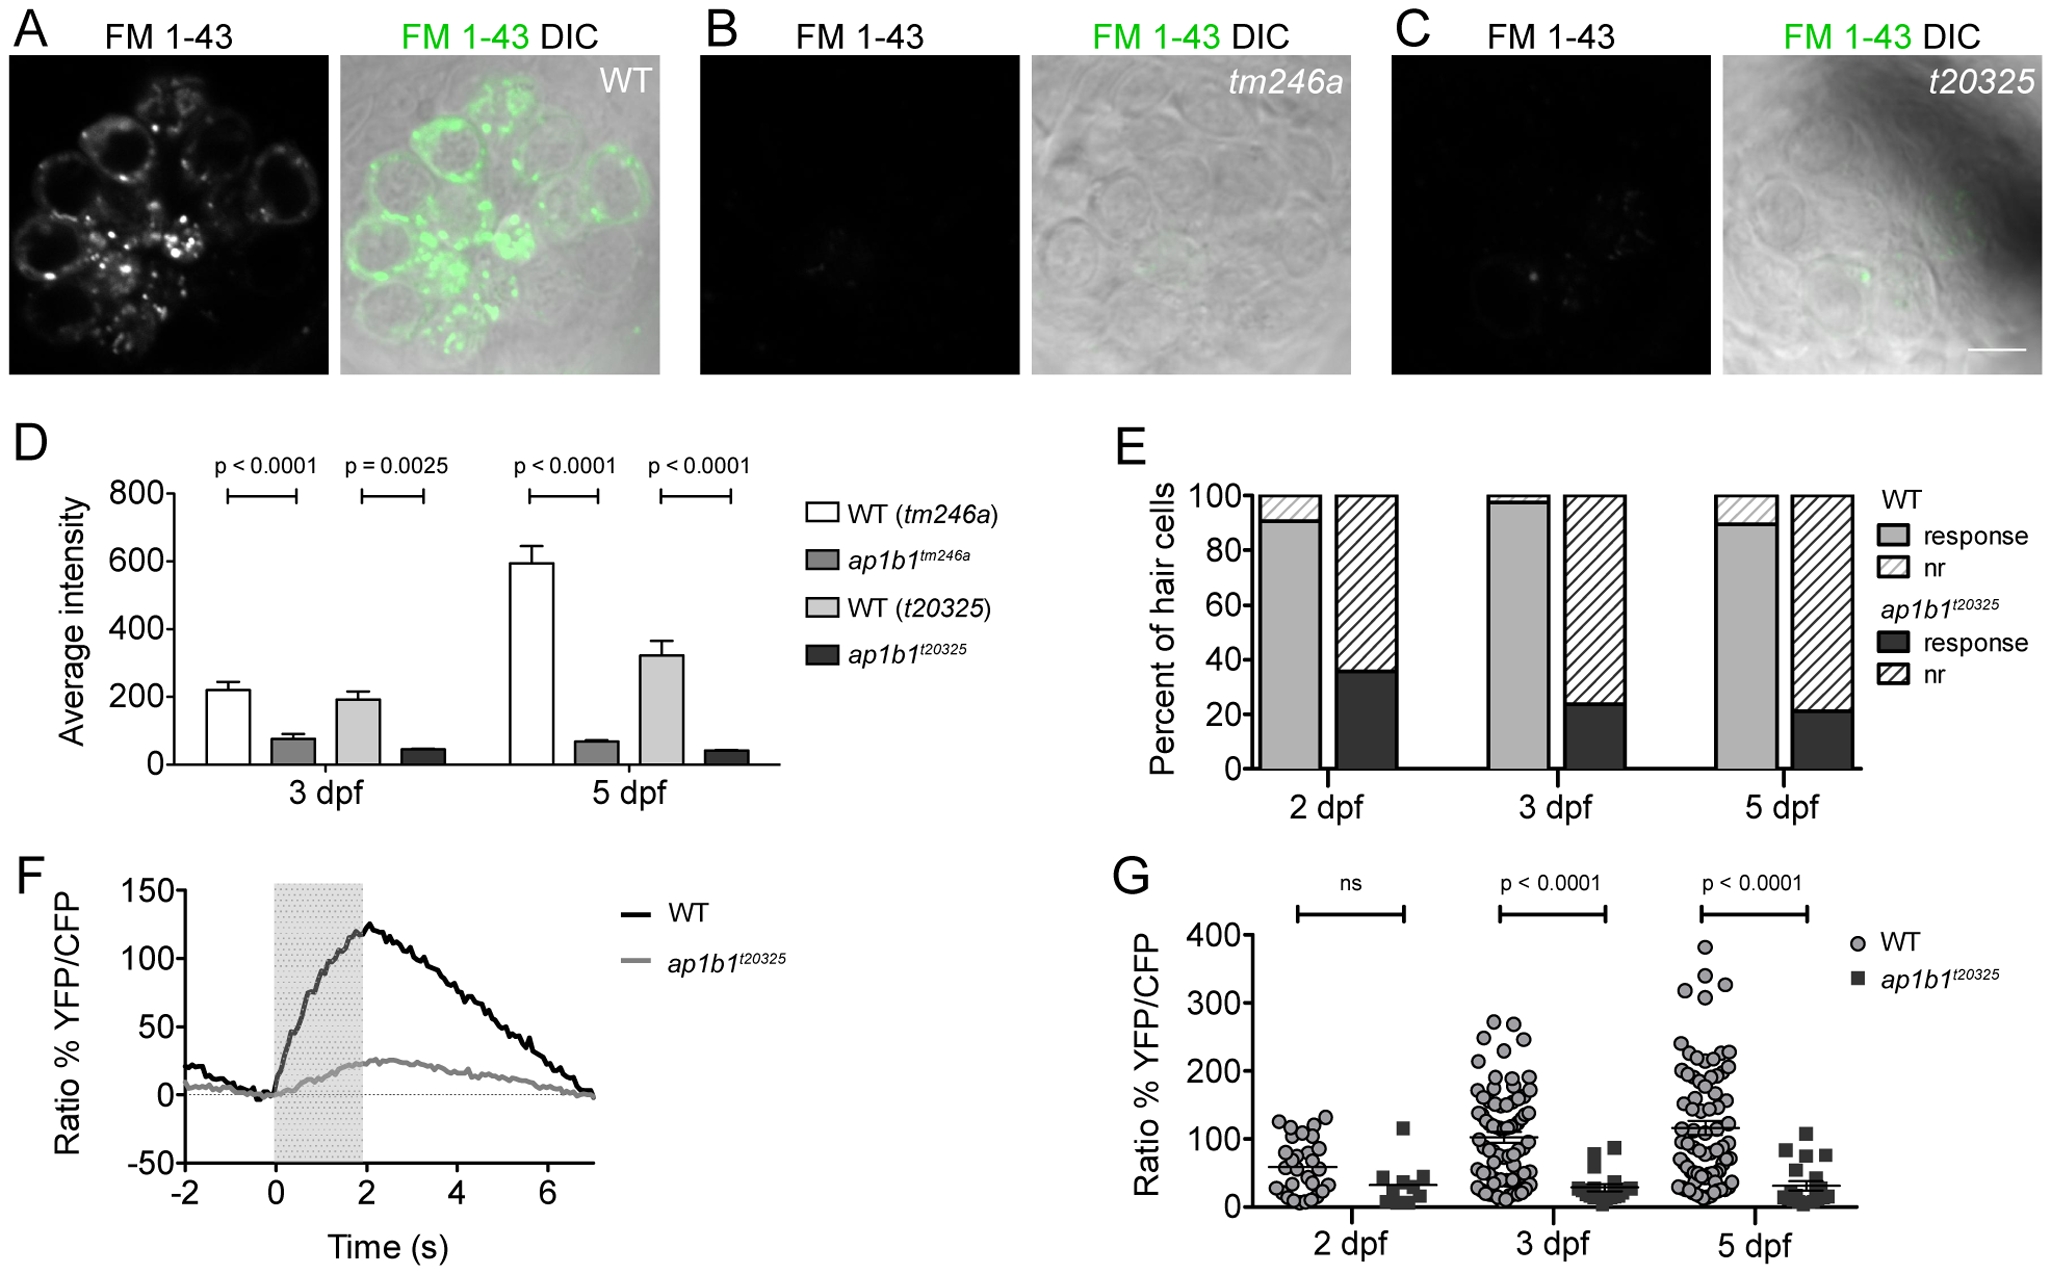
ap1b1 mutants have deficits in HC mechanotransduction.
A–C, FM 1-43 label of neuromast HCs in WT, tm246a and t20325 mutants at 5 dpf. Scale bars, 5 µm. D, Average intensity (A.U.) of FM 1-43 label in tm246a and t20325 mutants quantified at 3 dpf (tm246a: WT n = 18, mutant n = 5; t20325: WT n = 16, mutant n = 8 neuromasts) and 5 dpf (tm246a: WT n = 9, mutant n = 10; t20325: WT n = 12, mutant n = 11 neuromasts) from at least 3 larvae along with WT, age-matched siblings. E, The proportion of HCs displaying calcium transients in response to a water-jet stimulus (solid) compared to those that do not respond (nr = non-responders, hatched lines). The percent of non-responding HCs in the t20325 mutants is greater than the percent non-responders in WT at all stages of development assayed; Chi Squared test, p<0.0001. F, Trace representing the average calcium responses to a 2 sec water-jet stimulus from 5 dpf WT and t20325 mutant larvae (n = 20 HCs). The grey box indicates the timing of the water-jet stimulus. G, Dot plot showing calcium transients in WT and t20325 larvae at 2, 3 and 5 dpf (non-responders were excluded). Each point represents an individual HC. Error bars represent SEM and statistical analysis was performed using a Mann-Whitney U-test.