
|
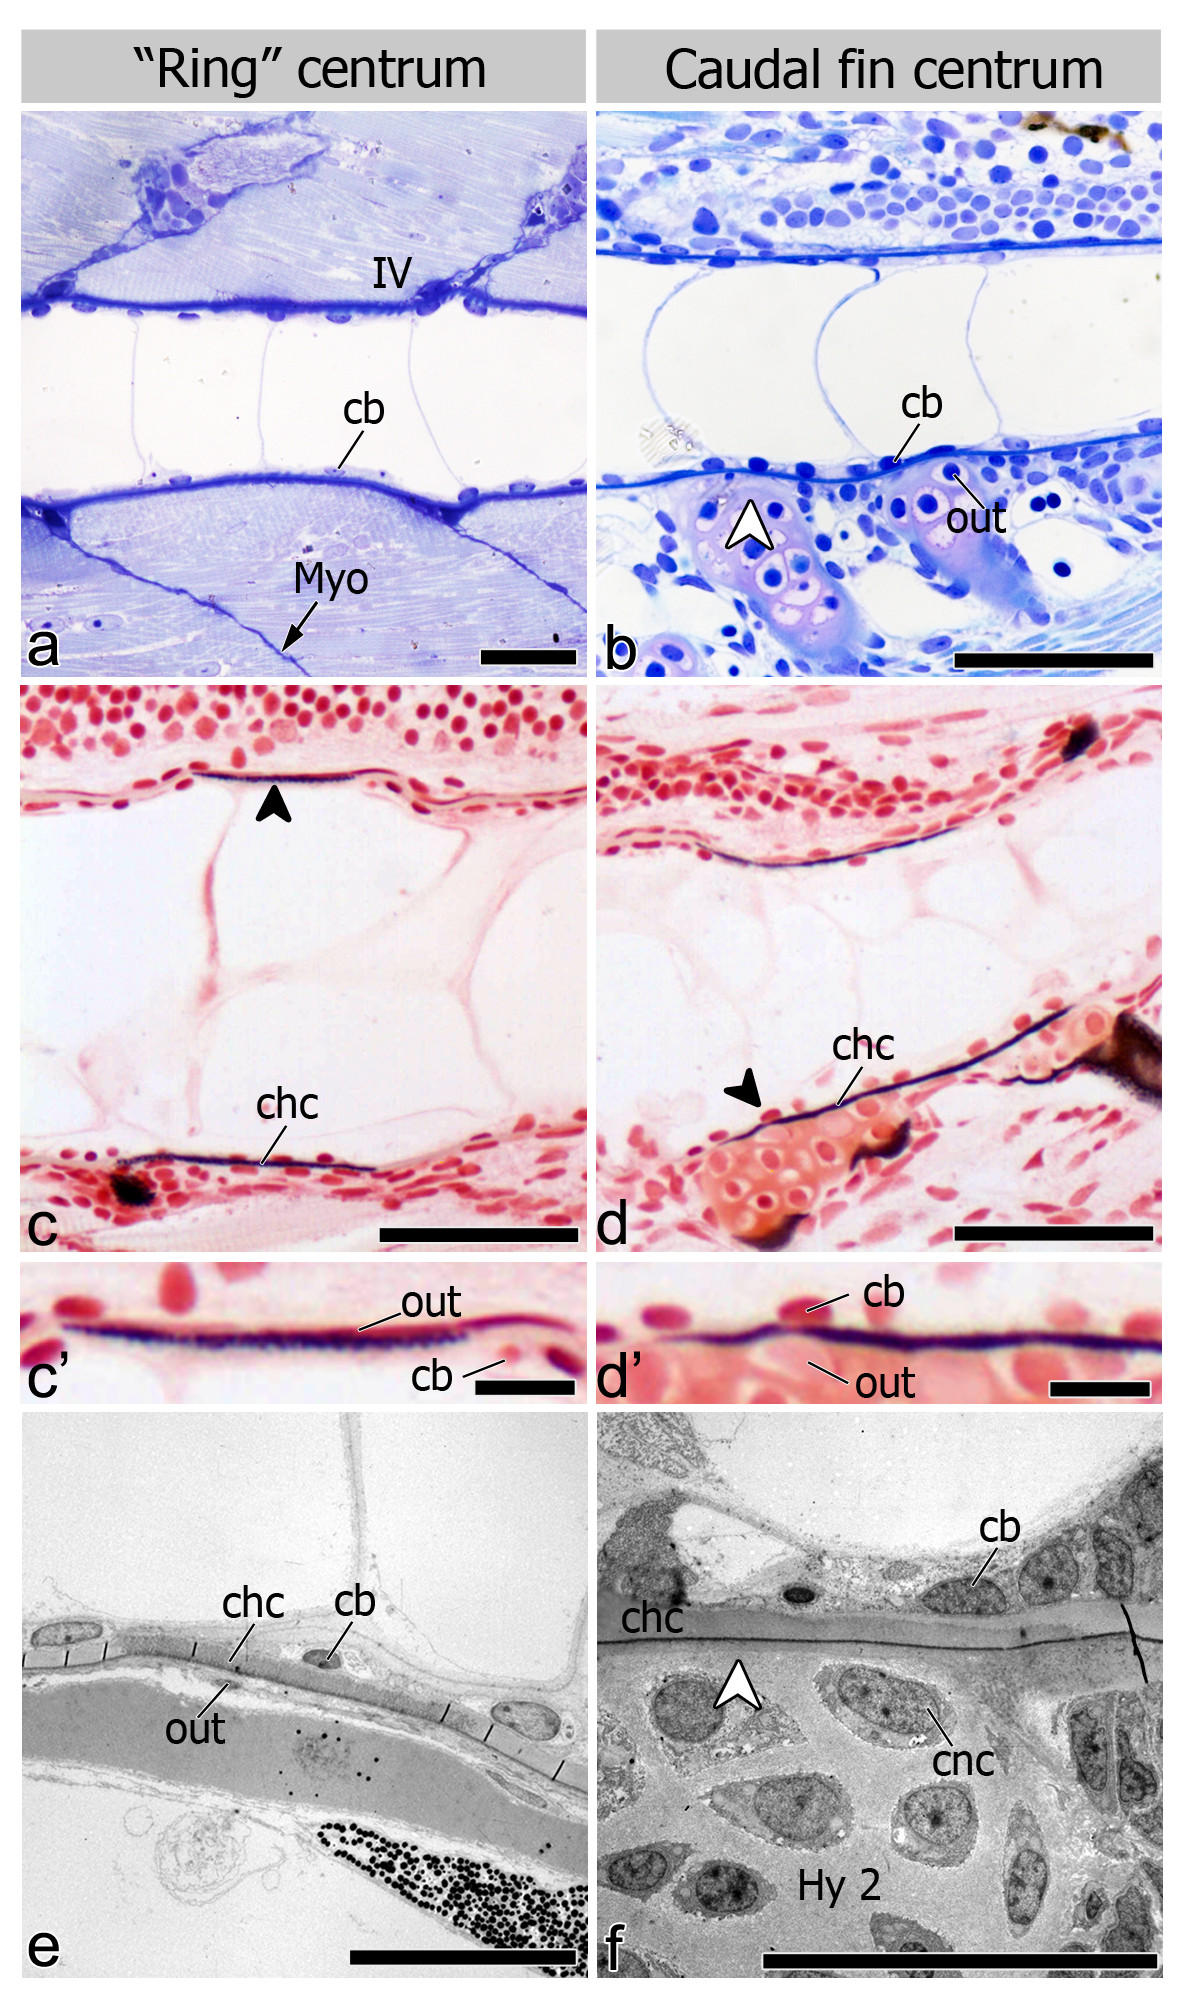
Fig. 4 Chordacentrum formation and cell distribution inside and outside the notochord. Lateral view of 6.0 mm TL fish (a-d′). (a, b) Toluidine blue stained sections show the distinct morphologies of (a) “ring” and (b) caudal fin chordacentrum but homogenous chordoblast (cb) distribution during chordacentrum mineralization. In caudal fin vertebrae, outer (out) cells associated with the centra are chondrocytes from the cartilaginous arches (white arrowhead); (c and d) von Kossa staining highlighting that early (c) “ring” and (d) caudal fin centrum mineralization occurs within the notochord sheath, thus forming the chordacentrum (chc; black arrowheads); (c′ and d′) details showing outer and inner cells in both (c′) “ring” (dorsal side) and (d′) caudal fin centra (ventral side). Lateral view of (e) 5 mm TL fish in TEM micrograph showing that both chordoblasts and outer cells (out) display a squamous morphology, associated with sites of “ring” chordacentrum mineralization, while in caudal fin centra (f) the cartilaginous matrix of the arches is directly attached to the notochord sheath (white arrowhead), leaving no space for cells other than chondrocytes (cnc) to interact with the chordacentrum outside the notochord (11 mm TL fish). Further abbreviation: Hy2 – Hypural 2; IV – intervertebral space; Myo – myoseptum. Scale bars (a-d): 50 μm; (c′, d′): 10 μm; (e, f): 20 μm.