
Image
|
Figure Caption
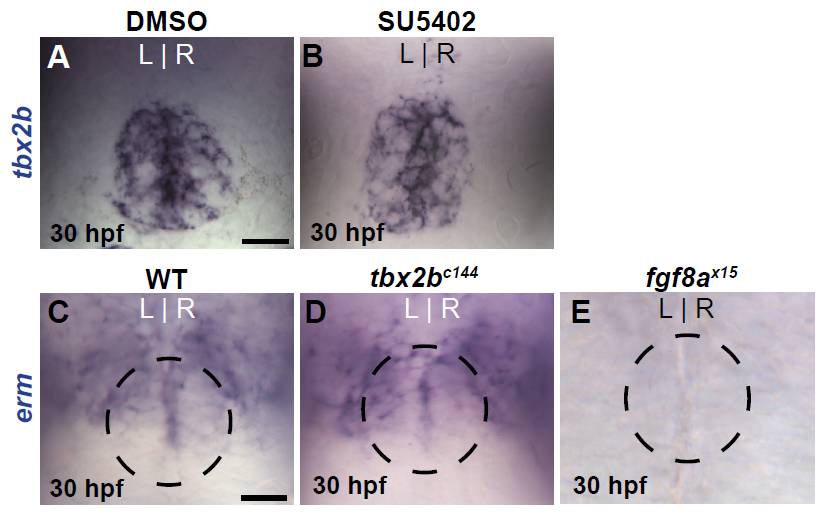
Fig. S8 Tbx2b and Fgf8a have no cross-regulatory relationship. (A,B) Dorsal views of DMSO- or SU5402 treated embryos labeled with tbx2b at 30 hpf. Embryos were treated from 24 to 30 hpf. (C-E) Dorsal view of erm expression in the pineal complex of WT, tbx2bc144 mutant and fgf8ax15 mutant embryos at 30 hpf. The position of the pineal is indicated by the dashed circle. Scale bars: 25 μm.
Acknowledgments
This image is the copyrighted work of the attributed author or publisher, and
ZFIN has permission only to display this image to its users.
Additional permissions should be obtained from the applicable author or publisher of the image.
Full text @ Development