
|
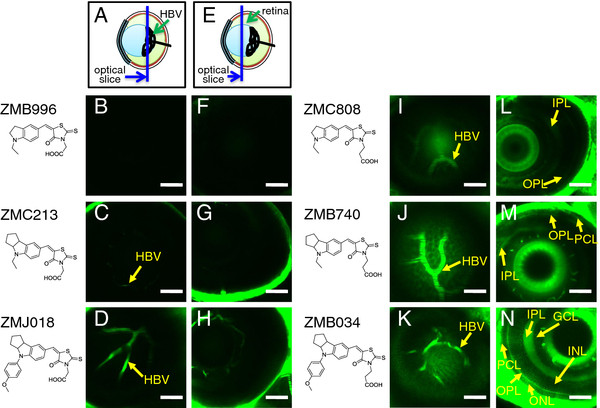
Fig. 2 In vivo assessment of the permeability of the BRB to fluorescent IDs. Zebrafish larvae (albino line) at 7–8 dpf were immersed in egg water containing 1 μM of ID. In vivo fluorescence imaging of the zebrafish retina was performed using a CLSM. Schematic diagram (A and E) showing the region of the eye containing the HBV (B-D, I-K) and multiple layers of retina (F-H, L-N) observed using the CLSM. B-D and F-H: In vivo fluorescence imaging of zebrafish larvae stained with IDs possessing a rhodanine ring with an acetic acid group (ZMB996, ZMC213, and ZMJ018, B and F, C and G, D and H, respectively). The HBV in zebrafish stained with ZMJ018 were clearly visualized. I-N: In vivo fluorescence imaging of zebrafish larvae stained with IDs possessing a rhodanine ring with an propanoic acid group (ZMC808, ZMB740, and ZMB034, I and L, J and M, K and N, respectively). Both the HBV and multiple layers of retina were clearly visualized in zebrafish stained with ZMB034. Bar: 50 μm. HBV, hyaloid blood vessel; IPL, inner plexiform layer; OPL, outer plexiform layer; PCL, photoreceptor cell layer; GCL, ganglion cell layer; INL, inner nuclear layer; ONL, outer nuclear layer.