
Fig. 7
- ID
- ZDB-IMAGE-121025-9
- Publication
- He et al., 2012 - How variable clones build an invariant retina
- All Figures
- Figures for He et al., 2012
|
Fig. 7
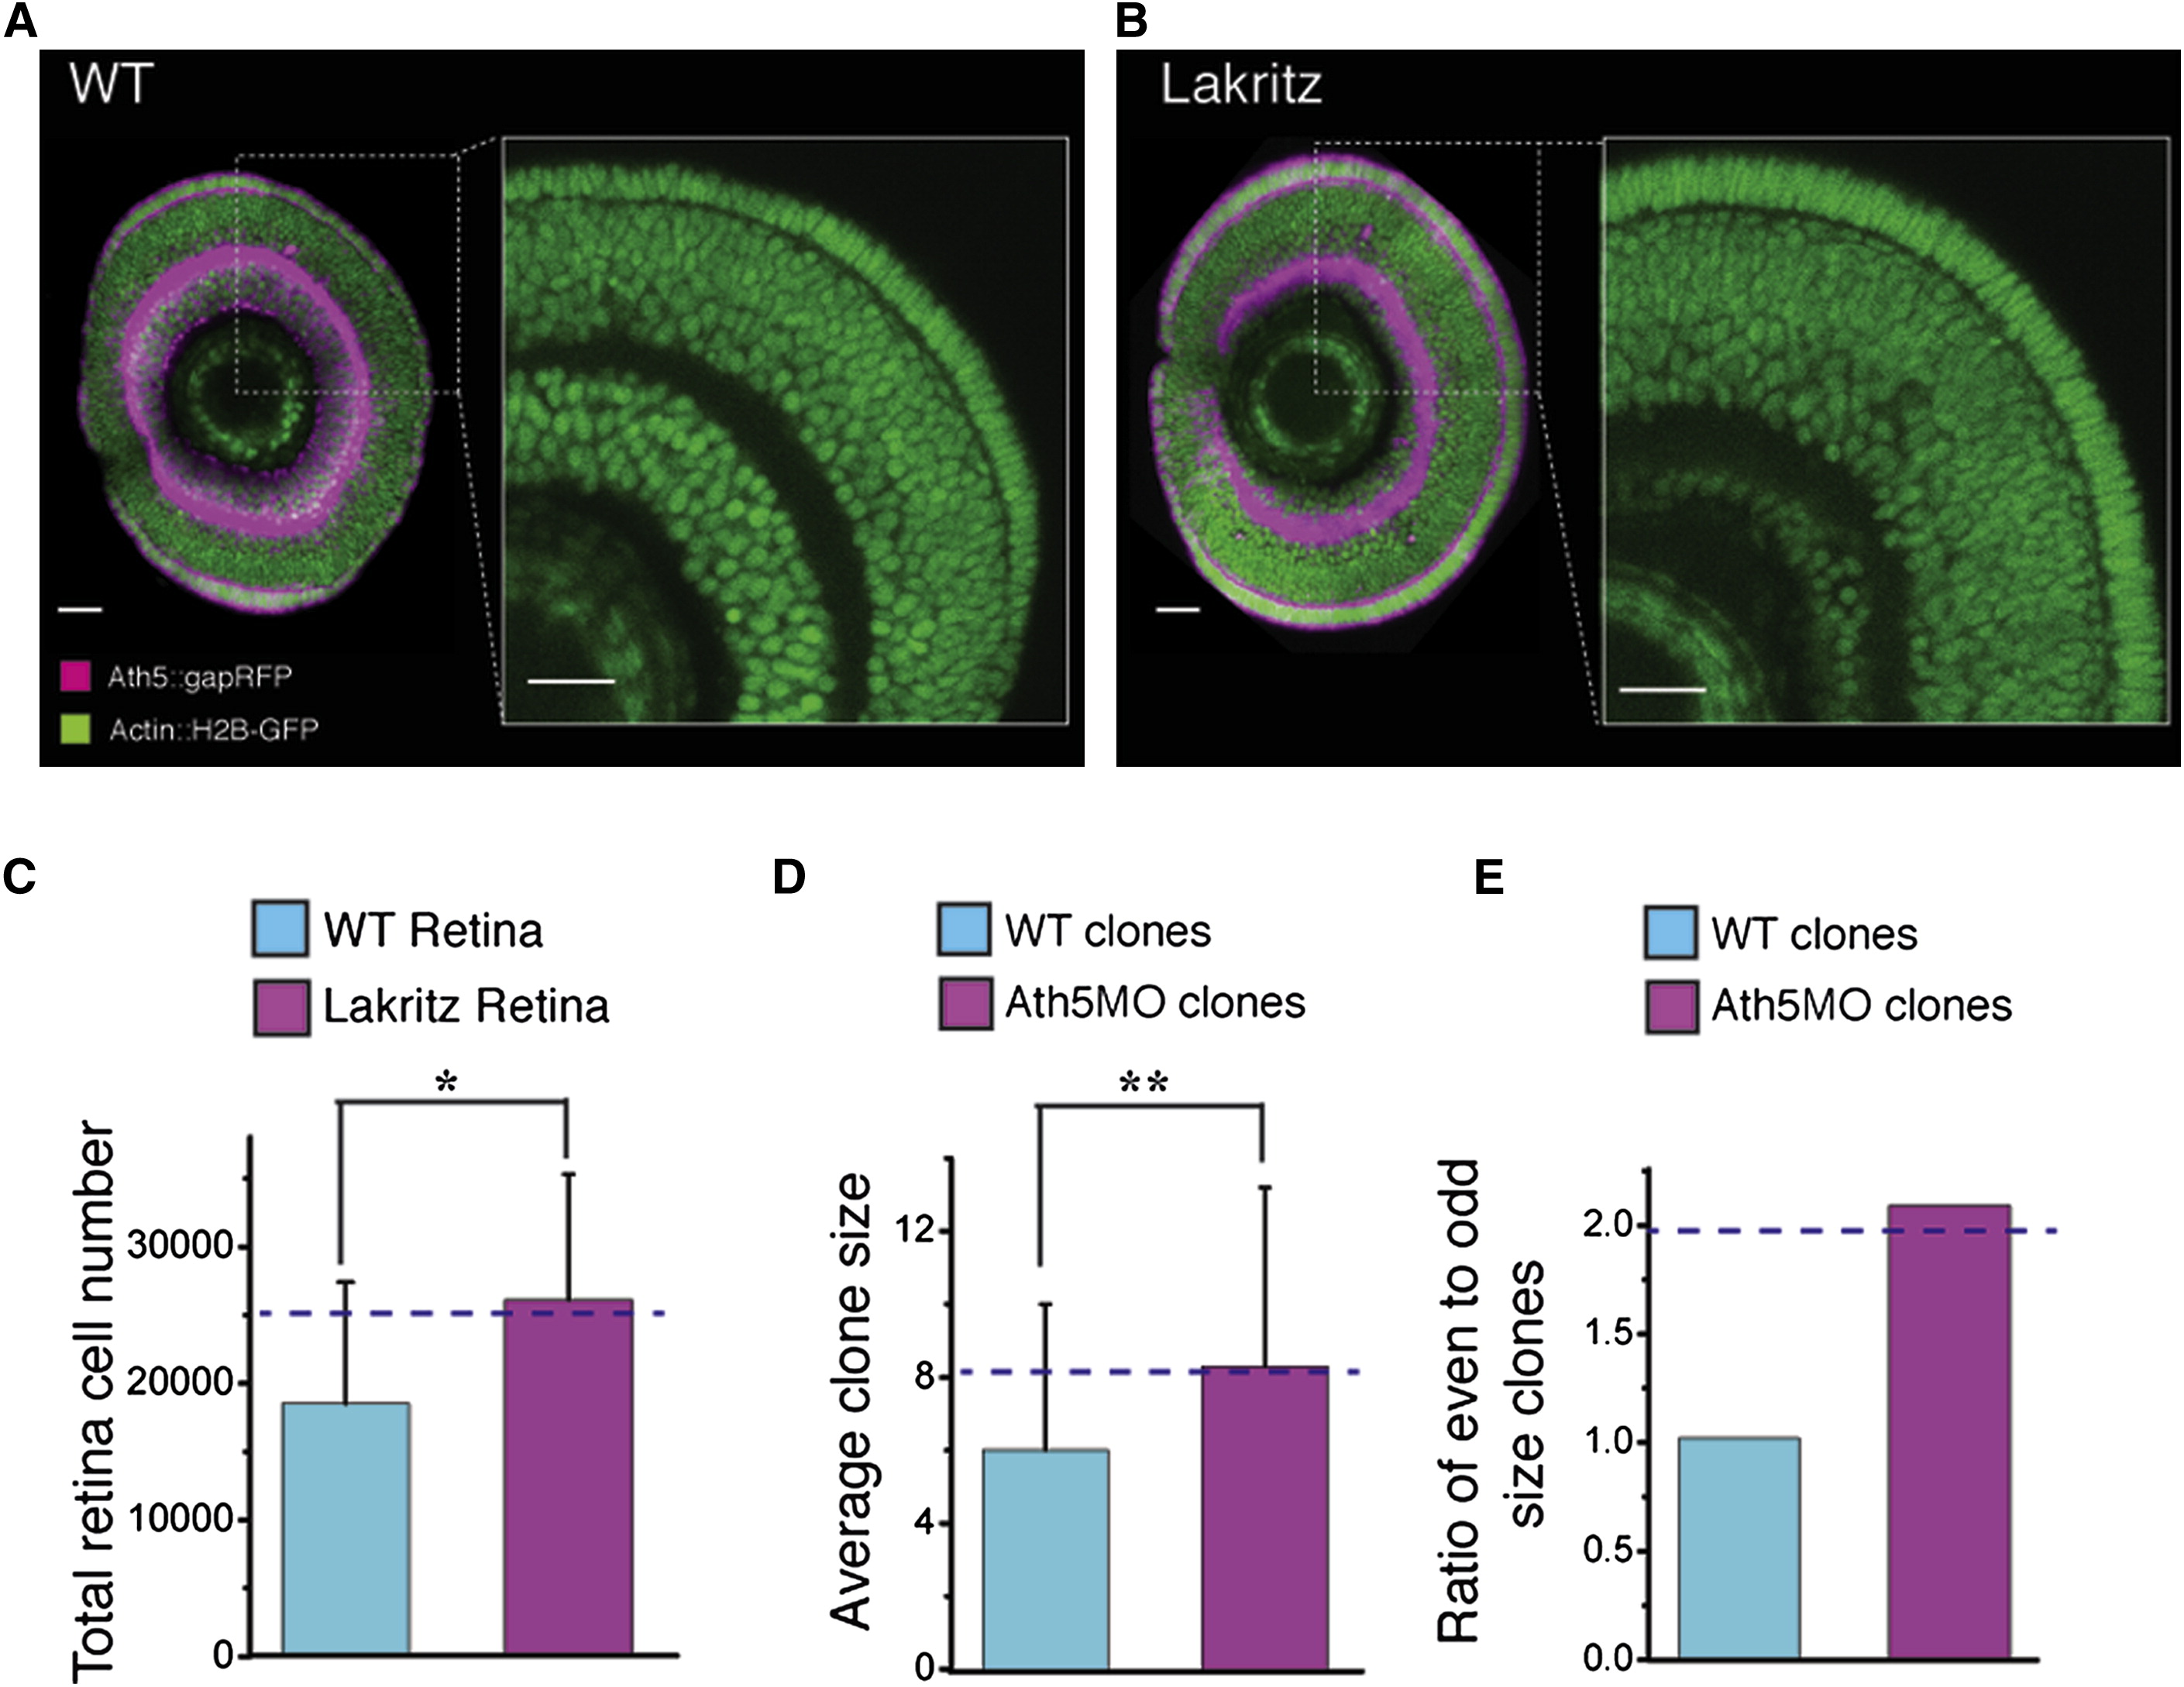
Total Retinal Cell Number Increase in Ath5 Mutants Predicted by Modeling (A and B) Zoomed-in images of a retina sagittal section of wild-type (WT) (A) and lakritz (B) retina, showing cell number increase in the lakritz retina. Scale bar represents 23 µm. (C and D) Quantified increase in total cell number in the lakritz retina (C) and the average clone size in Ath5 morpholino (Ath5MO)-injected retinas (D). The dashed lines represent the model prediction. Values are represented as mean ± SD (n = 4, WT retina; n = 3, lakritz retina; n = 169, clones in the WT retina; n = 34, clones in the Ath5MO-injected retina; *p < 0.05, **p < 0.05, Student’s t test). (E) Ath5MO-injected clones are biased toward even numbers, as predicted by the model (dashed line).