
|
Fig. S2
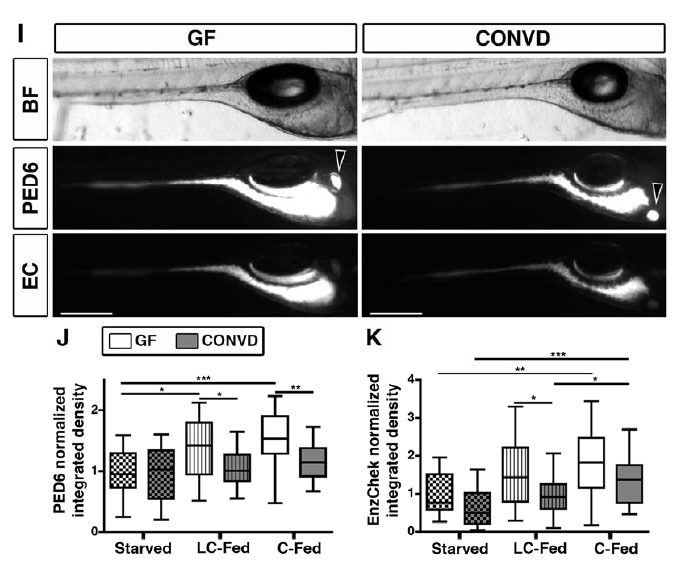
related to Figure 3. Comparison of Feeding Behavior, Growth Rates, GI Tract Organ Size and Digestive Function between 6 dpf GF and CONVD Zebrafish
(A) A fluorescent bead-eating assay was used to determine the feeding behavior of 6 dpf GF and CONVD zebrafish reared under different dietary conditions. We counted the number of fluorescent microspheres in the intestines of individual fixed zebrafish. Zebrafish under the tested microbial and dietary conditions contained similar number of ingested beads. The results show individual samples and the means from two independent experiments. (B) Body size was determined by measuring the length from the snout to the end of the notochord (standard length). The graph represents means from at least two independent experiments. (C-E) Transgenic zebrafish lines were used to measure the area of GI tract organs – liver, pancreas and pancreatic islet. We used the Tg(lfabp:DsRed; elaA:GFP) line (C,D) to determine the size of the liver and pancreas. Scale bar, 200 μm. We used Tg(in3.2-Mmu.Fos:GFP)nc15 fish to measure the area of the single pancreatic islet (E). Scale bar, 50 μm. (F-H) Quantification of area size for liver, pancreas and islet. Measurements were collected from two independent experiments. The data analysis was performed in ImageJ and shows no significant effects of the microbiota or diet on the morphology of liver (F), pancreas (G) and the islet (H) in 6 dpf zebrafish. Each circle represents results from a single animal. Student’s t tests adjusted with Bonferroni’s correction for multiple comparisons revealed no significant differences. (I) Representative images of live 6 dpf GF and CONVD zebrafish fed a control diet that were simultaneously soaked in quenched PED6 and EnzChek (EC) substrates for 3 hr. Brightfield images show the intestinal region of GF and CONVD zebrafish. Overexposed images of unquenched PED6 show fluorescence in the intestinal lumen and gallbladder of GF and CONVD zebrafish (arrowhead). Overexposed images of unquenched EnzChek shows that TxRed signal is primarily detected in the intestinal lumen. Scale bar, 200 μm. (J,K) Box-and-whiskers plots of total intestinal fluorescence in GF and CONVD zebrafish under three dietary conditions. The fluorescence signal was quantified using underexposed images in ImageJ software as integrated density (area x mean fluorescence). The data were normalized to the mean of the GF starved condition for each substrate. PED6 (J) and EnzChek (K) normalized integrated densities show reduced fluorescent signal in CONVD zebrafish fed LC or C diet compared to their GF controls. Results of Student’s t test corrected with Bonferroni’s method for multiple comparisons: *, p<0.05; **, p<0.01; ***, p<0.001.