
|
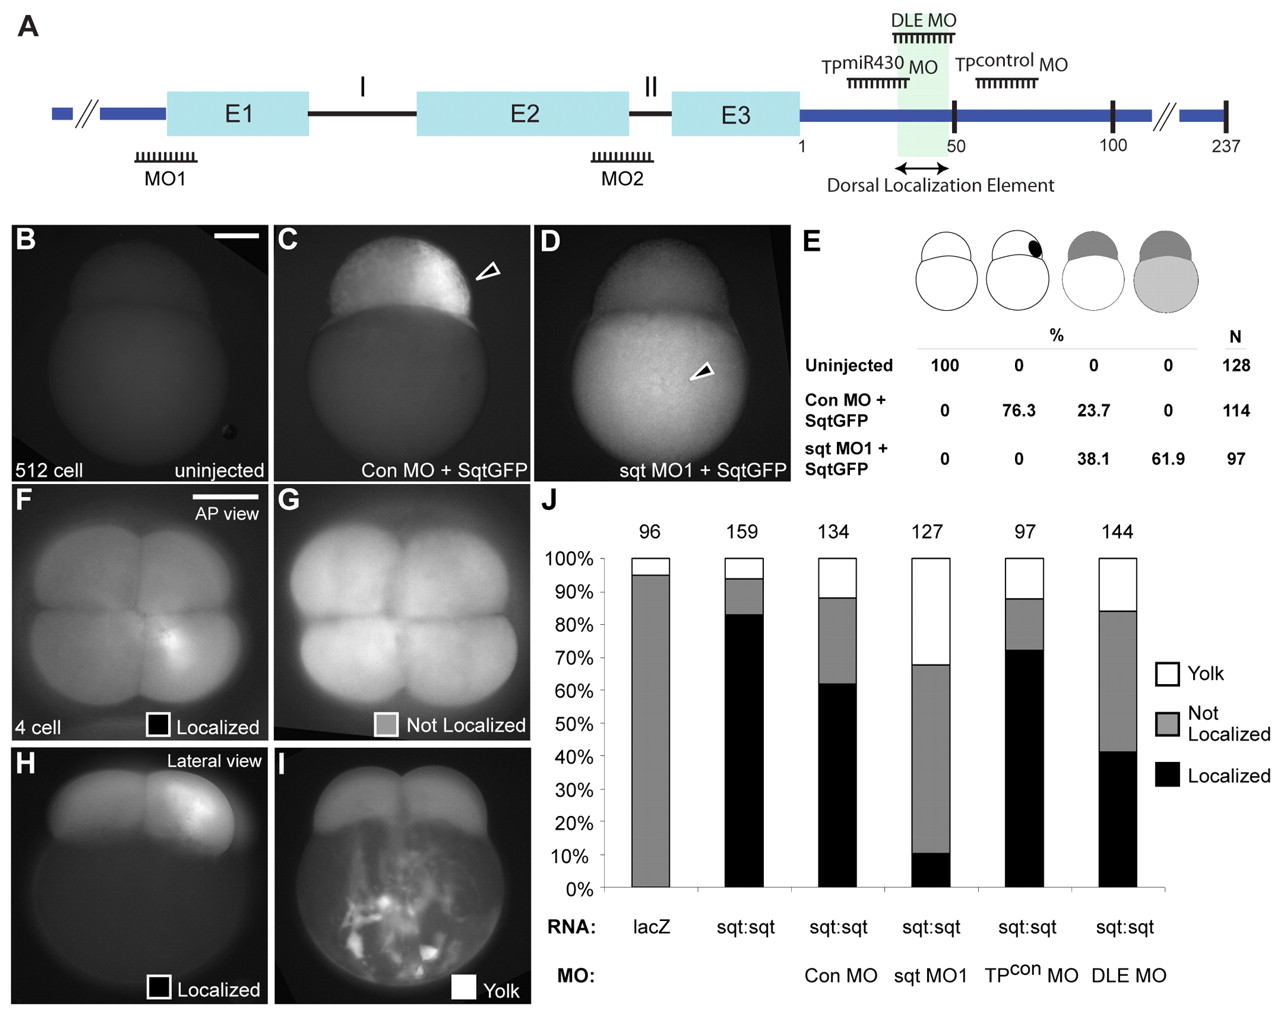
Fig. 6 Morpholinos targeting the sqt ATG disrupt sqt RNA localization. (A) The zebrafish sqt genomic locus (not to scale) indicating positions of the sqt ATG morpholino (MO1), sqt intron 2 morpholino (MO2), sqt DLE morpholino (DLE MO), sqt miR430 target protector morpholino (TPmiR430 MO), and target protector control morpholino (TPcontrol MO). Introns (I and II), exons (E1, E2 and E3; cyan boxes) and UTR (dark blue line) are indicated. The dorsal localization element is highlighted in green. (B-D) Embryos injected with sqt-GFP RNA show asymmetric expression of Sqt-GFP fluorescent protein in the blastoderm of 512-cell stage embryos (C), in comparison to uninjected embryos (B) and embryos co-injected with sqtMO1 and sqt-GFP that show Sqt-GFP fluorescence in the yolk (D). (E) Numbers (N) and percentage of embryos showing no expression, expression of Sqt-GFP in the blastoderm, yolk, or both. (F-I) Localization of injected fluorescent control lacZ or sqt:sqt RNA in 4-cell stage embryos co-injected with control morpholinos, sqtMO1, TPcontrol MO or DLE MO. (J) Percentage and number of embryos (top) showing sqt RNA localized (F,H), not localized (G), or as aggregates in the yolk (I). Lateral views at 512-cell stage (B-D) or 4-cell stage (H,I), or animal pole views at 4-cell stage (F,G). Scale bars: 100 μm.