
|
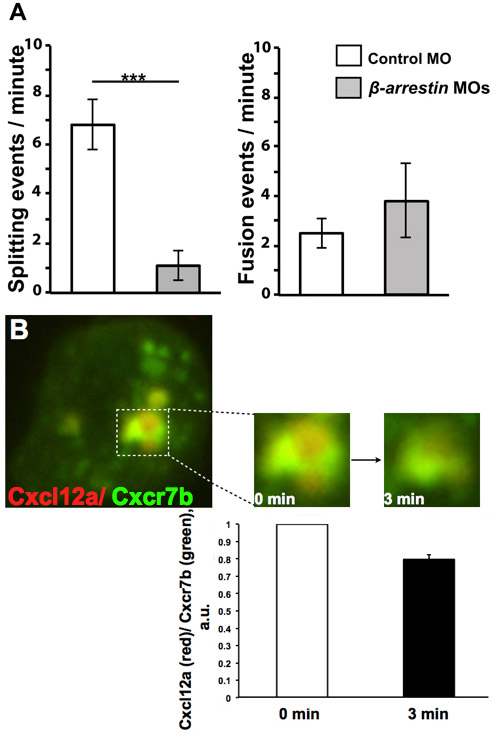
Fig. S6
Quantitation of splitting and fusion events of Cxcr7-containing vesicles and decay of Cxcl12-Cherry signal with respect to that of Cxcr7b-EGFP. (A) Cxcr7b foci in wild-type control cells show higher numbers of splitting events per minute than cells knocked down for β-arrestin function (***P<0.001, Student’s t-test). By contrast, no significant difference in fusion of Cxcr7b foci was observed between control and β-arrestin knockdown cells. Error bars indicate s.e.m. Analysis was performed on six time-lapse movies. (B) Dynamics of Cxcl12a degradation in β-arrestin morphant cells. Graph illustrates the intensity ratio between Cxcl12a (tagged with mCherry, red) and Cxcr7b (EGFP-tagged, green) channels measured for individual foci at two time points, 3 minutes apart. Analysis was performed for three foci from two time-lapse movies with the ratio at the beginning of the movie (0 min) set to 1 for each of the foci. Error bars indicate s.e.m.