
|
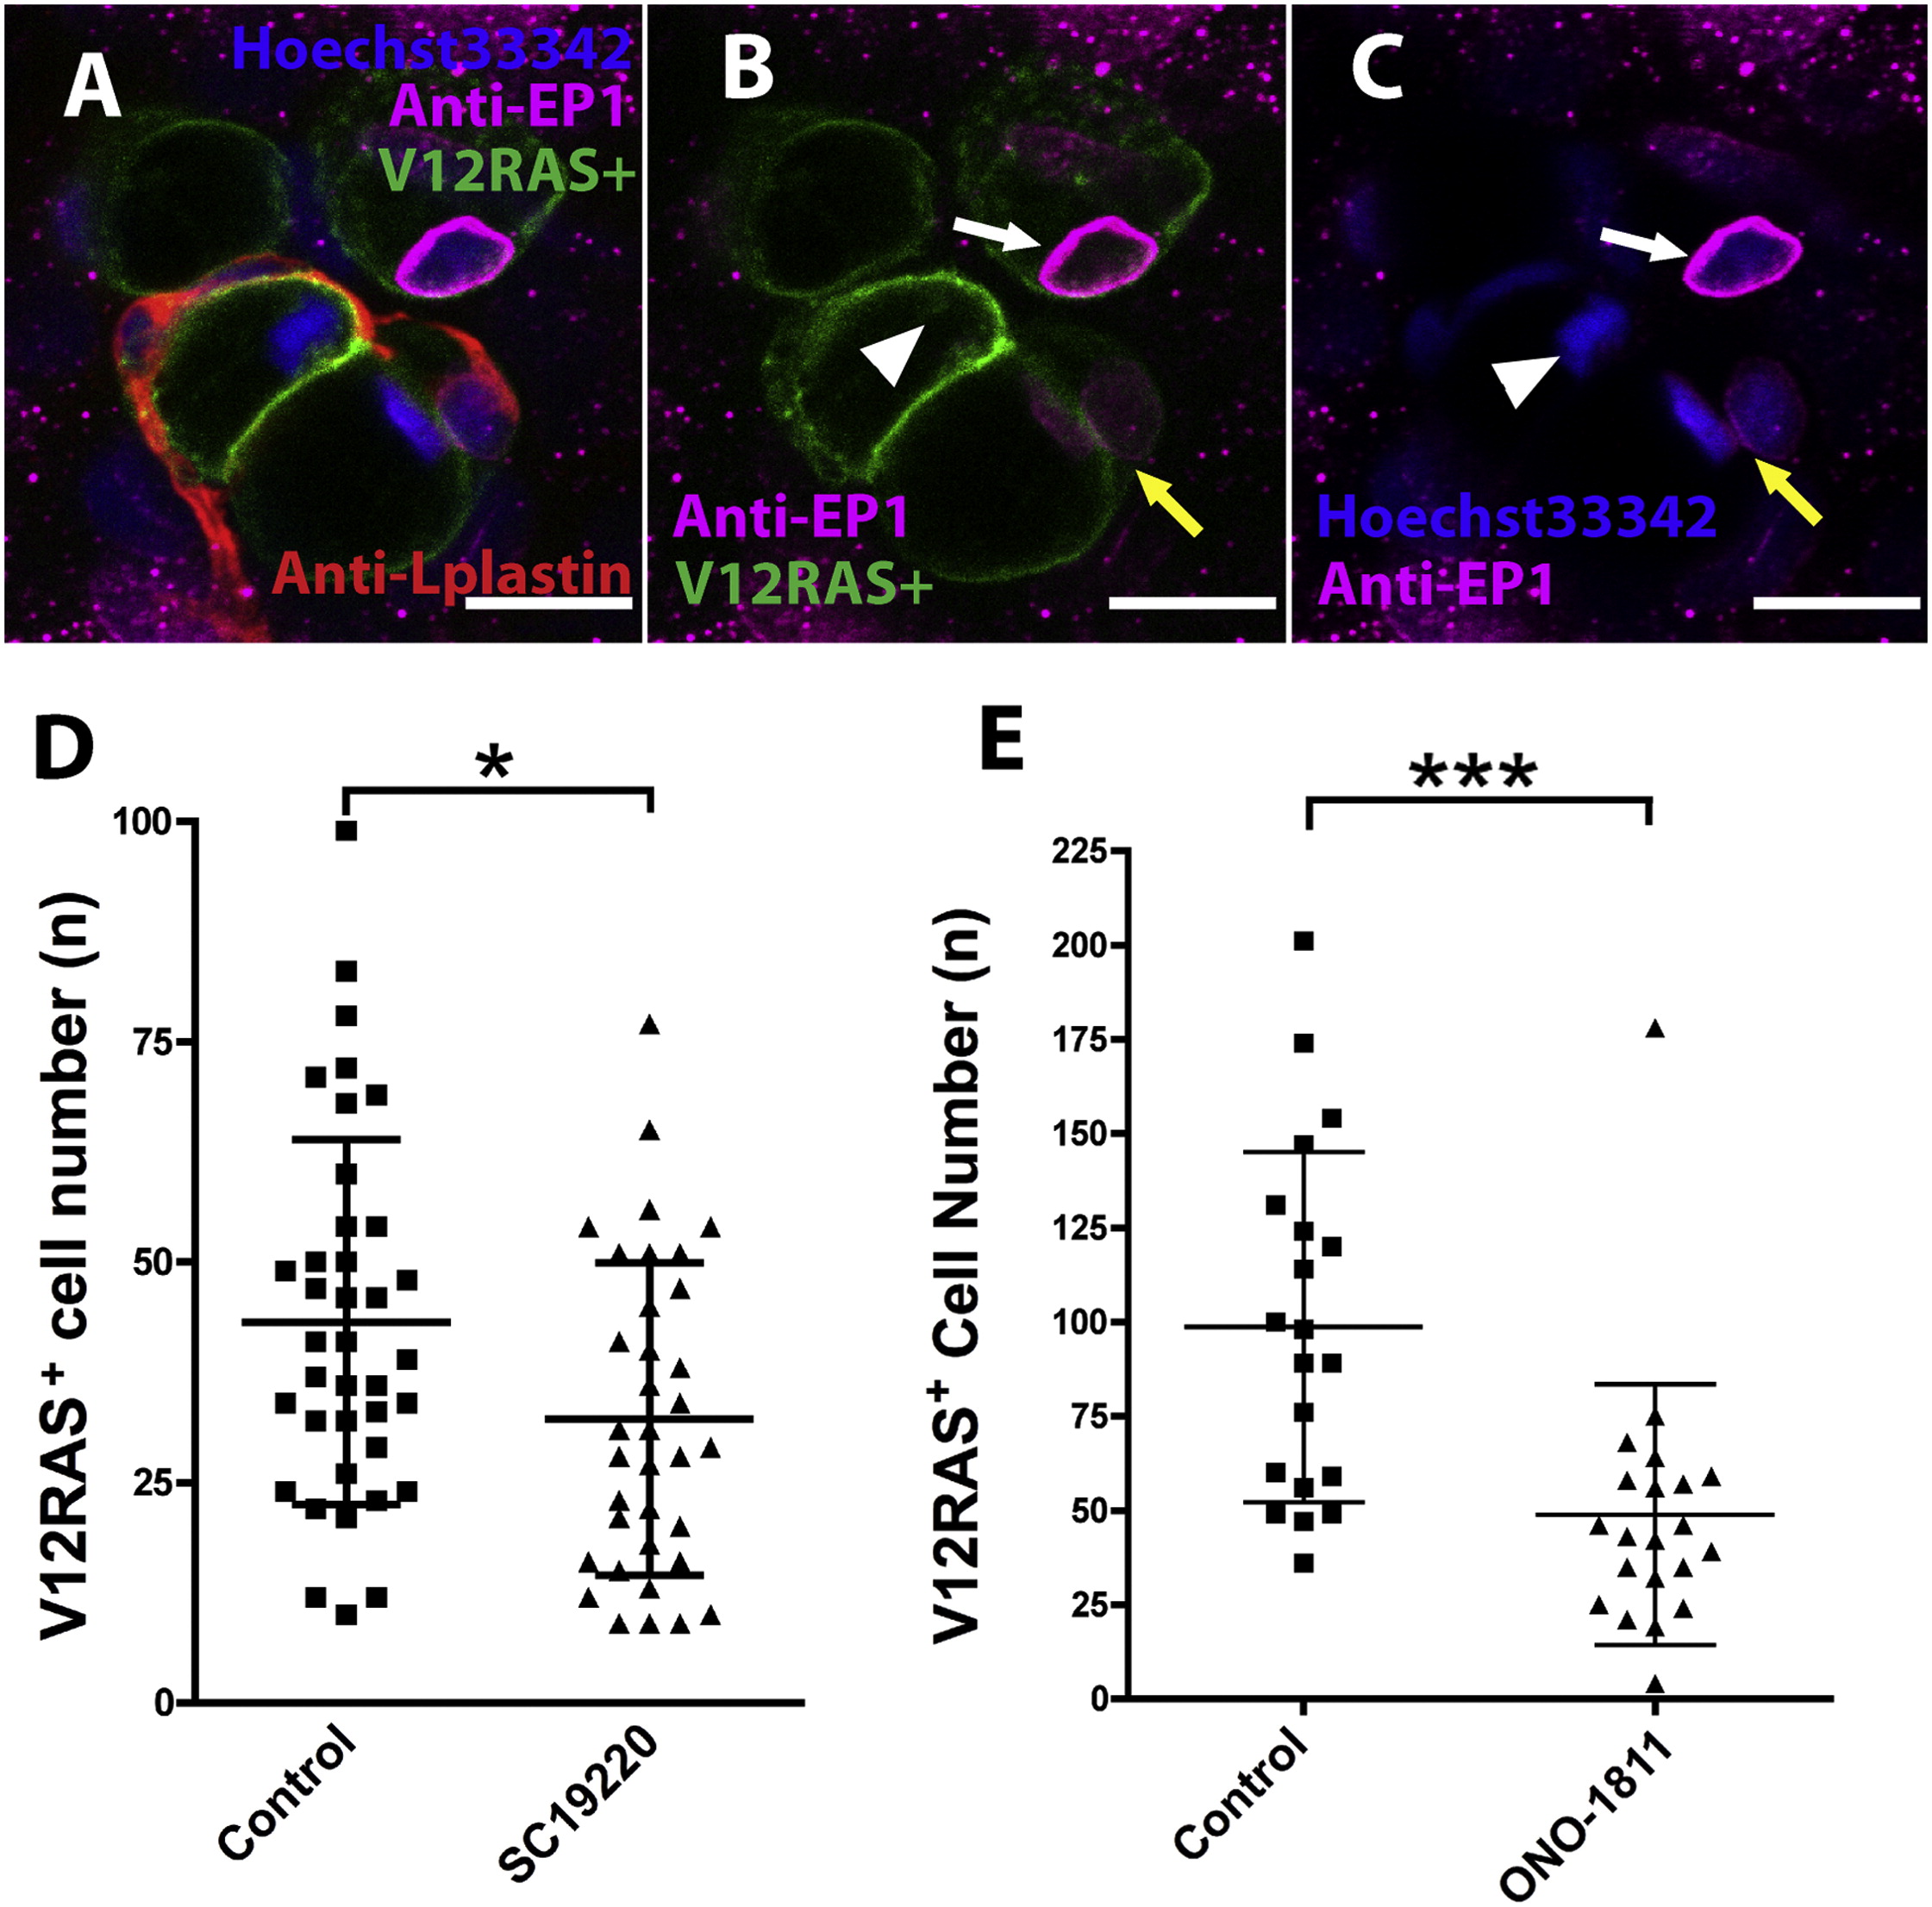
Fig. 2 PGE2 Promotes Growth of Transformed Cells via the EP1 Receptor(A–C) Immunostaining for EP1 receptor showing EP1 (magenta) localized within V12RASeGFP+ cells (green); nuclei are stained with Hoechst 33342 (blue), and leukocytes are revealed by immunostaining with anti-L-plastin antibody (red). EP1 receptor (magenta) shows perinuclear localization (white arrows in [B] and [C]); a pair of recently divided daughter transformed cells exhibit faint EP1 staining (yellow arrows in [B] and [C]), and a transformed cell at metaphase shows no EP1 signal (white arrowhead in [C]). Scale bars represent 10 μm.(D) Graphic illustration showing that EP1 receptor antagonist SC19220 leads to a reduction in the number of transformed cells (p < 0.05, n = 38 and 35).(E) The same is true for the EP1 receptor antagonist ONO-1811 (p < 0,001, n = 20 and 21).See also Figure S1.