
|
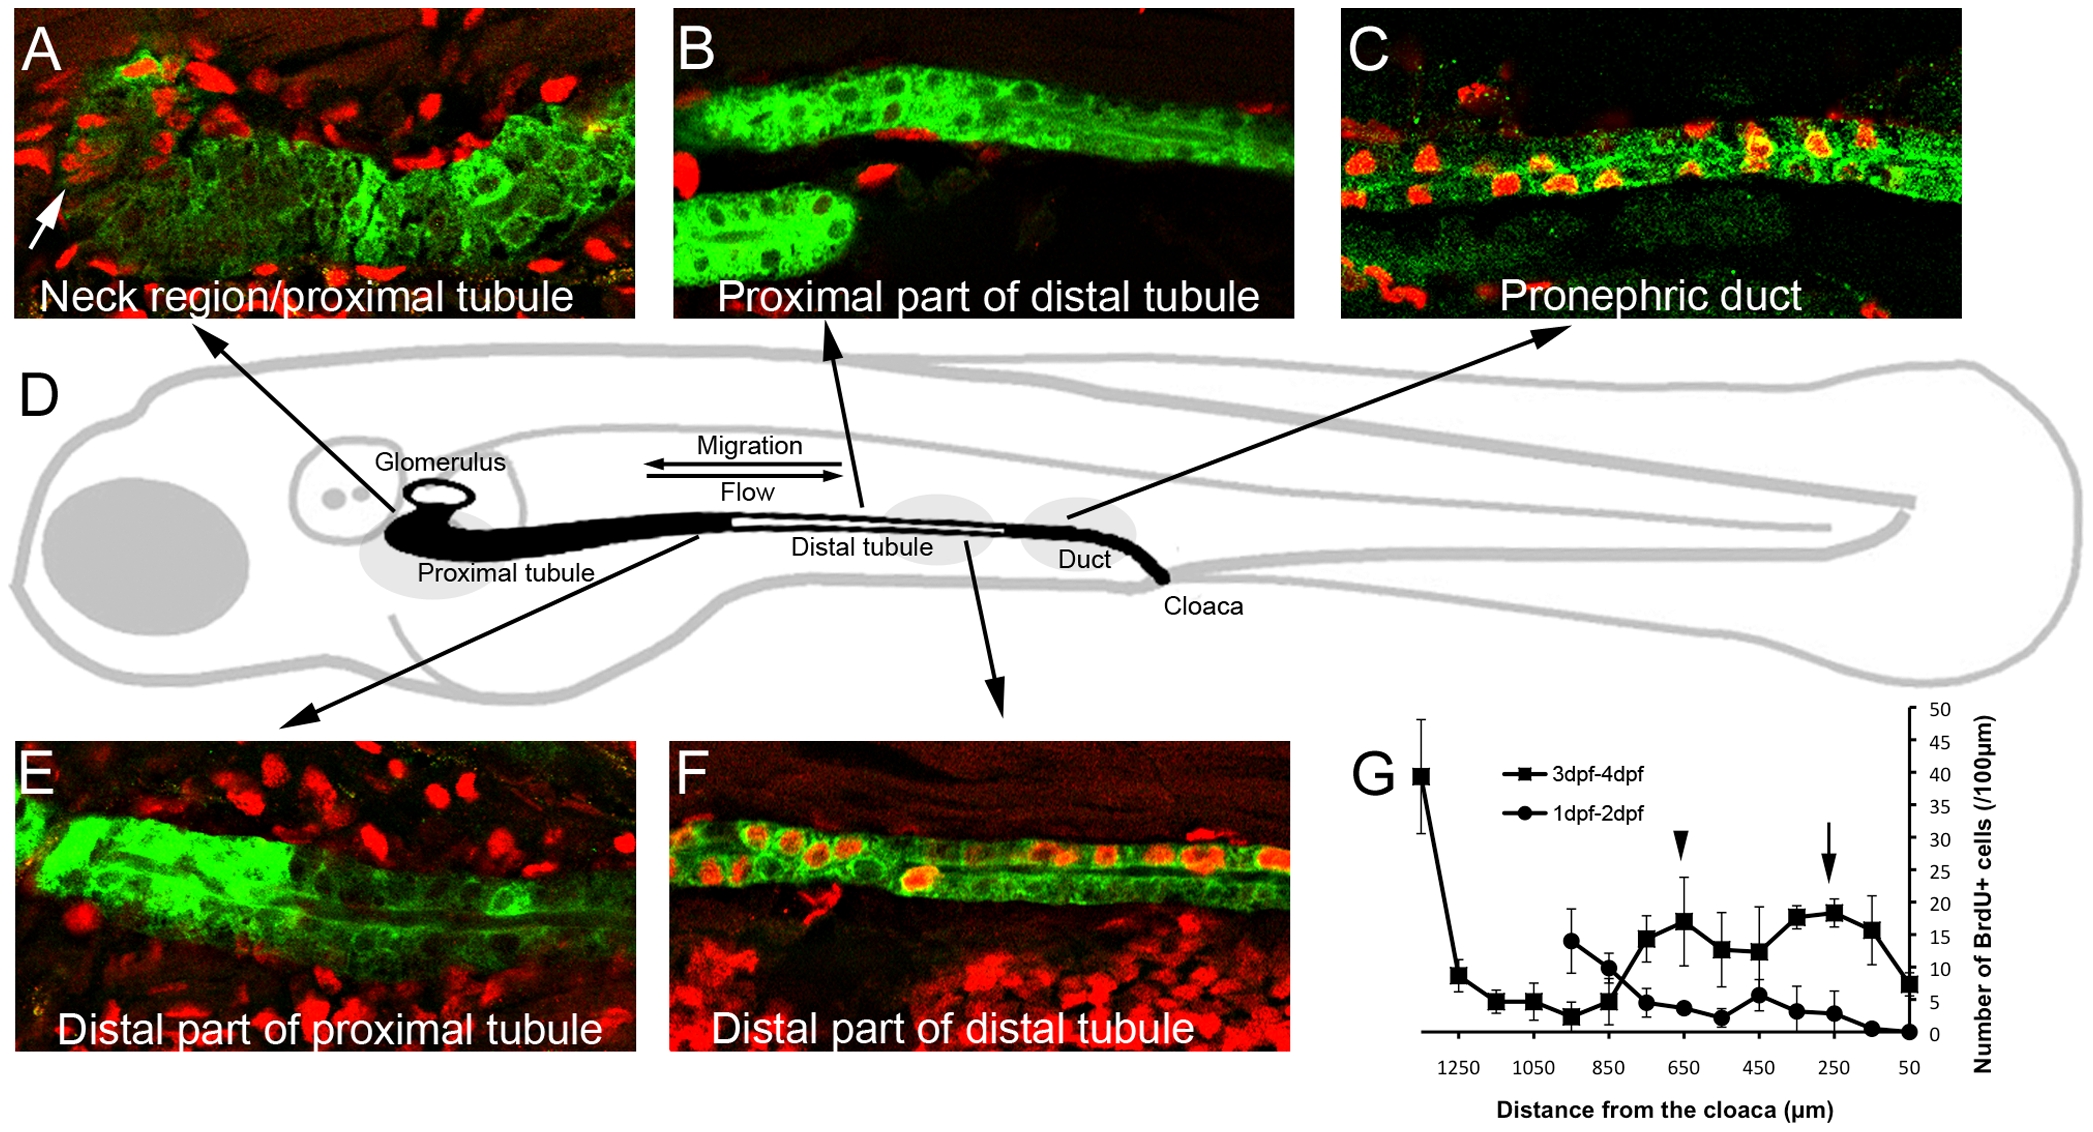
Fig. 1
Pronephric epithelial proliferation.
(A–C,E,F) Red: anti-BrdU staining, Green: anti-GFP staining. BrdU incorporation was measured for 24 h, between 48 and 72 hpf. (A) Proliferation in the proximal tubule is localized to the neck region (arrow). (B) Proliferation in the anterior part of the distal tubule is low. (C) Proliferation in the ret1-positive pronephric duct segment is high. (D) Cartoon depicting zebrafish pronephros. The proximal tubule (ET33d10 GFP positive domain) and the pronephric duct (ret1:GFP positive domain) are shaded black. The glomerulus and the distal tubule (ET11-9 GFP positive domain) are not shaded. (E) Proliferation in the posterior proximal tubule is low. (F) Proliferation in the posterior distal tubule is high. (G) Quantification of pronephric epithelial proliferation after 24 hour BrdU incorporation. The length of the tubule is plotted on the horizontal axis (measured from the cloaca). The linear density of BrdU positive nuclei (per 100 μm tubule length) is plotted on the vertical axis. Squares: pronephric proliferation between 3 and 4 dpf (n = 3). Circles: proliferation between 1 and 2 dpf (n = 3). See also Figure S1.