
|
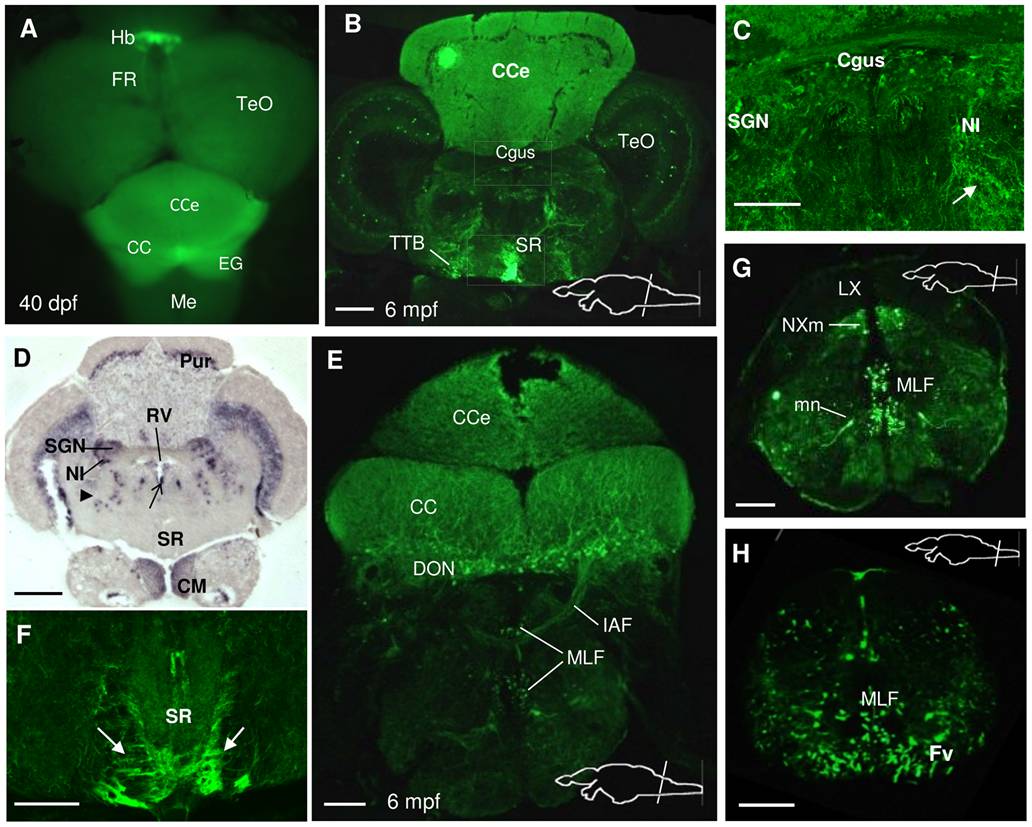
Fig. 9 Spon1b expression in the hindbrain. A.
Dorsal view of a freshly-dissected Tg(spon1b:GFP) juvenile zebrafish showing relative position of the paired habenular nuclei (Hb), emerging fasciculus retroflexus (FR), optic tectum (TeO), cerebellar corpus (Cce), granular eminence (EG), and medulla (Me). B. Coronal section of adult zebrafish brain at the level of the cerebellar corpus showing spon1b:GFP positive projections within the cerebellum, and to the superior raphe (SR). Tectobulbar tract (TTB). C. Spon1b:GFP signal in cells of the secondary gustatory nucleus (SGN), in the gustatory commissure (Cgus), and in scattered cells and projections throughout the tegmentum (arrow), and nucleus isthmi (NI). (High magnification picture of area in B). D. Spon1b mRNA expression (in situ hybridization) in Purkinje cell layer (Pur), ventral tip of rhomboencephalic ventricle (rv), SGN, nucleus isthmi (NI), superior reticular nucleus (arrowhead) and mammillary bodies (CM). Note the lack of signal in the Cgus and SR, confirming that the spon1b:GFP label in these regions comes from projections and not cell bodies. E. Coronal section at the level of the caudal cerebellum showing spon1b-positive cells and thick projections from cerebellar crest (CC), the descending octaval nuclei (DON) and the commissure that joins the nuclei, the internal arcuate fibers (IAF) coursing in between the axons of the medial longitudinal fasciculus (MLF). F. Spon1b-positive FR fibers (arrows) terminating on both sides of the ventral region of SR (high magnification image of area boxed in B). G. Coronal section at the level of the caudal medulla showing spon1b:GFP expression in the vagal motor nucleus (NXm), but not in the vagal lobe (LX). Note the symmetrically labeled motor neurons (mn), and the strongly labeled axons of the MLF and motor neuron axons in the ventral funiculus (Fv). H. Coronal section of the spinal cord showing spon1b:GFP expression in the axons of MLF and the ventral funiculus (Fv). Scale bars: B, F-H: 100 μm; C-D: 50 μm; E: 200 μm.