
Fig. S1
- ID
- ZDB-IMAGE-120710-38
- Publication
- Carlin et al., 2012 - Six3 cooperates with Hedgehog signaling to specify ventral telencephalon by promoting early expression of Foxg1a and repressing Wnt signaling
- All Figures
- Figures for Carlin et al., 2012
|
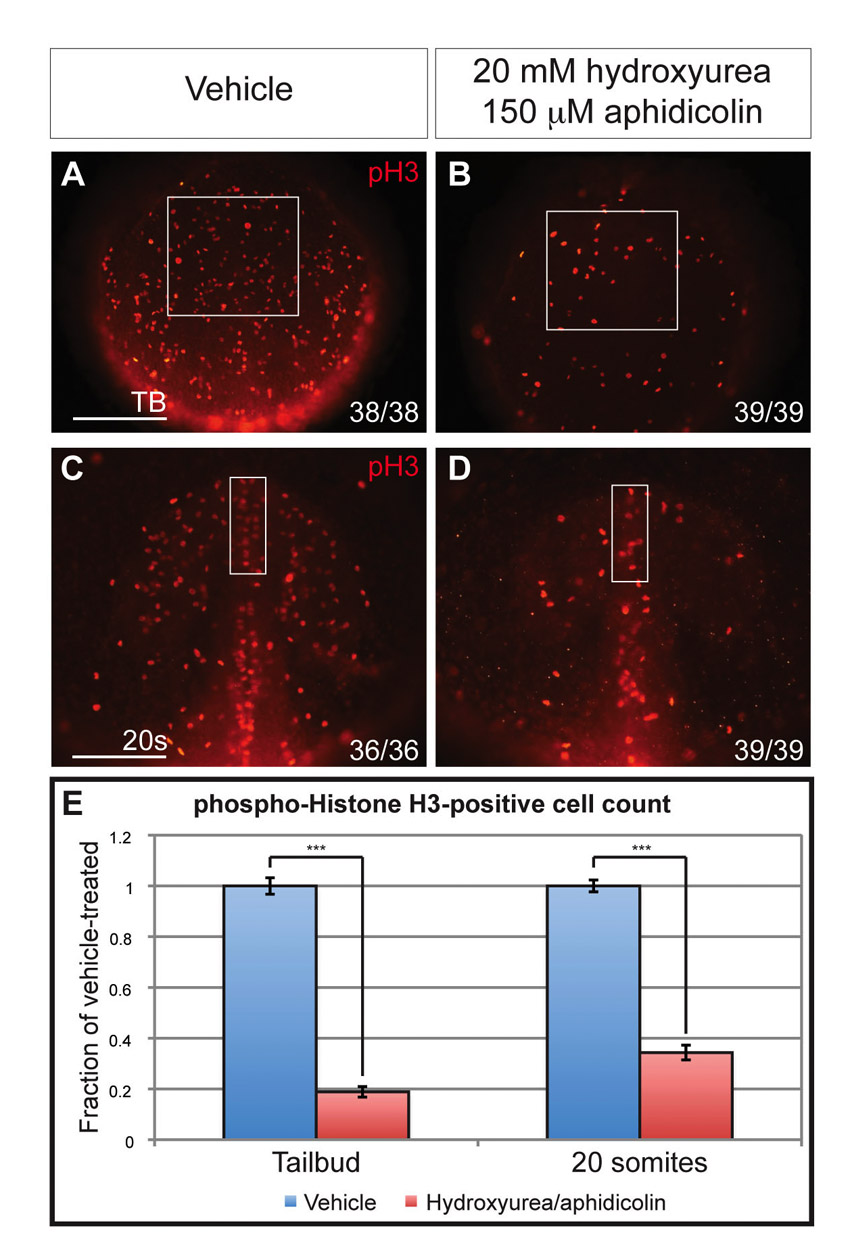
Fig. S1 Cellular proliferation is inhibited by hydroxyurea/aphidicolin treatment. (A-D) phospho-Histone H3 labeling in tailbud stage (A,B) and 20-somite stage (C,D) embryos treated with 2% dimethyl sulfoxide alone (A,C) or with 20 mM hydroxyurea and 150 μM aphidicolin from 80% epiboly (B,D). Boxed regions mark anterior neuroectoderm (A,B) and telencephalic region (C,D). Scale bars: 100 μm. (E) Quantification of phospho-Histone H3-positive cells in the boxed regions of panels A-D divided by average cell count in vehicle-treated embryos. n=10 embryos quantified for each sample. Blue and red columns denote vehicle- and hydroxyurea/aphidicolin-treated embryos, respectively. Error bars indicate s.e.m. ***P<0.001.