
|
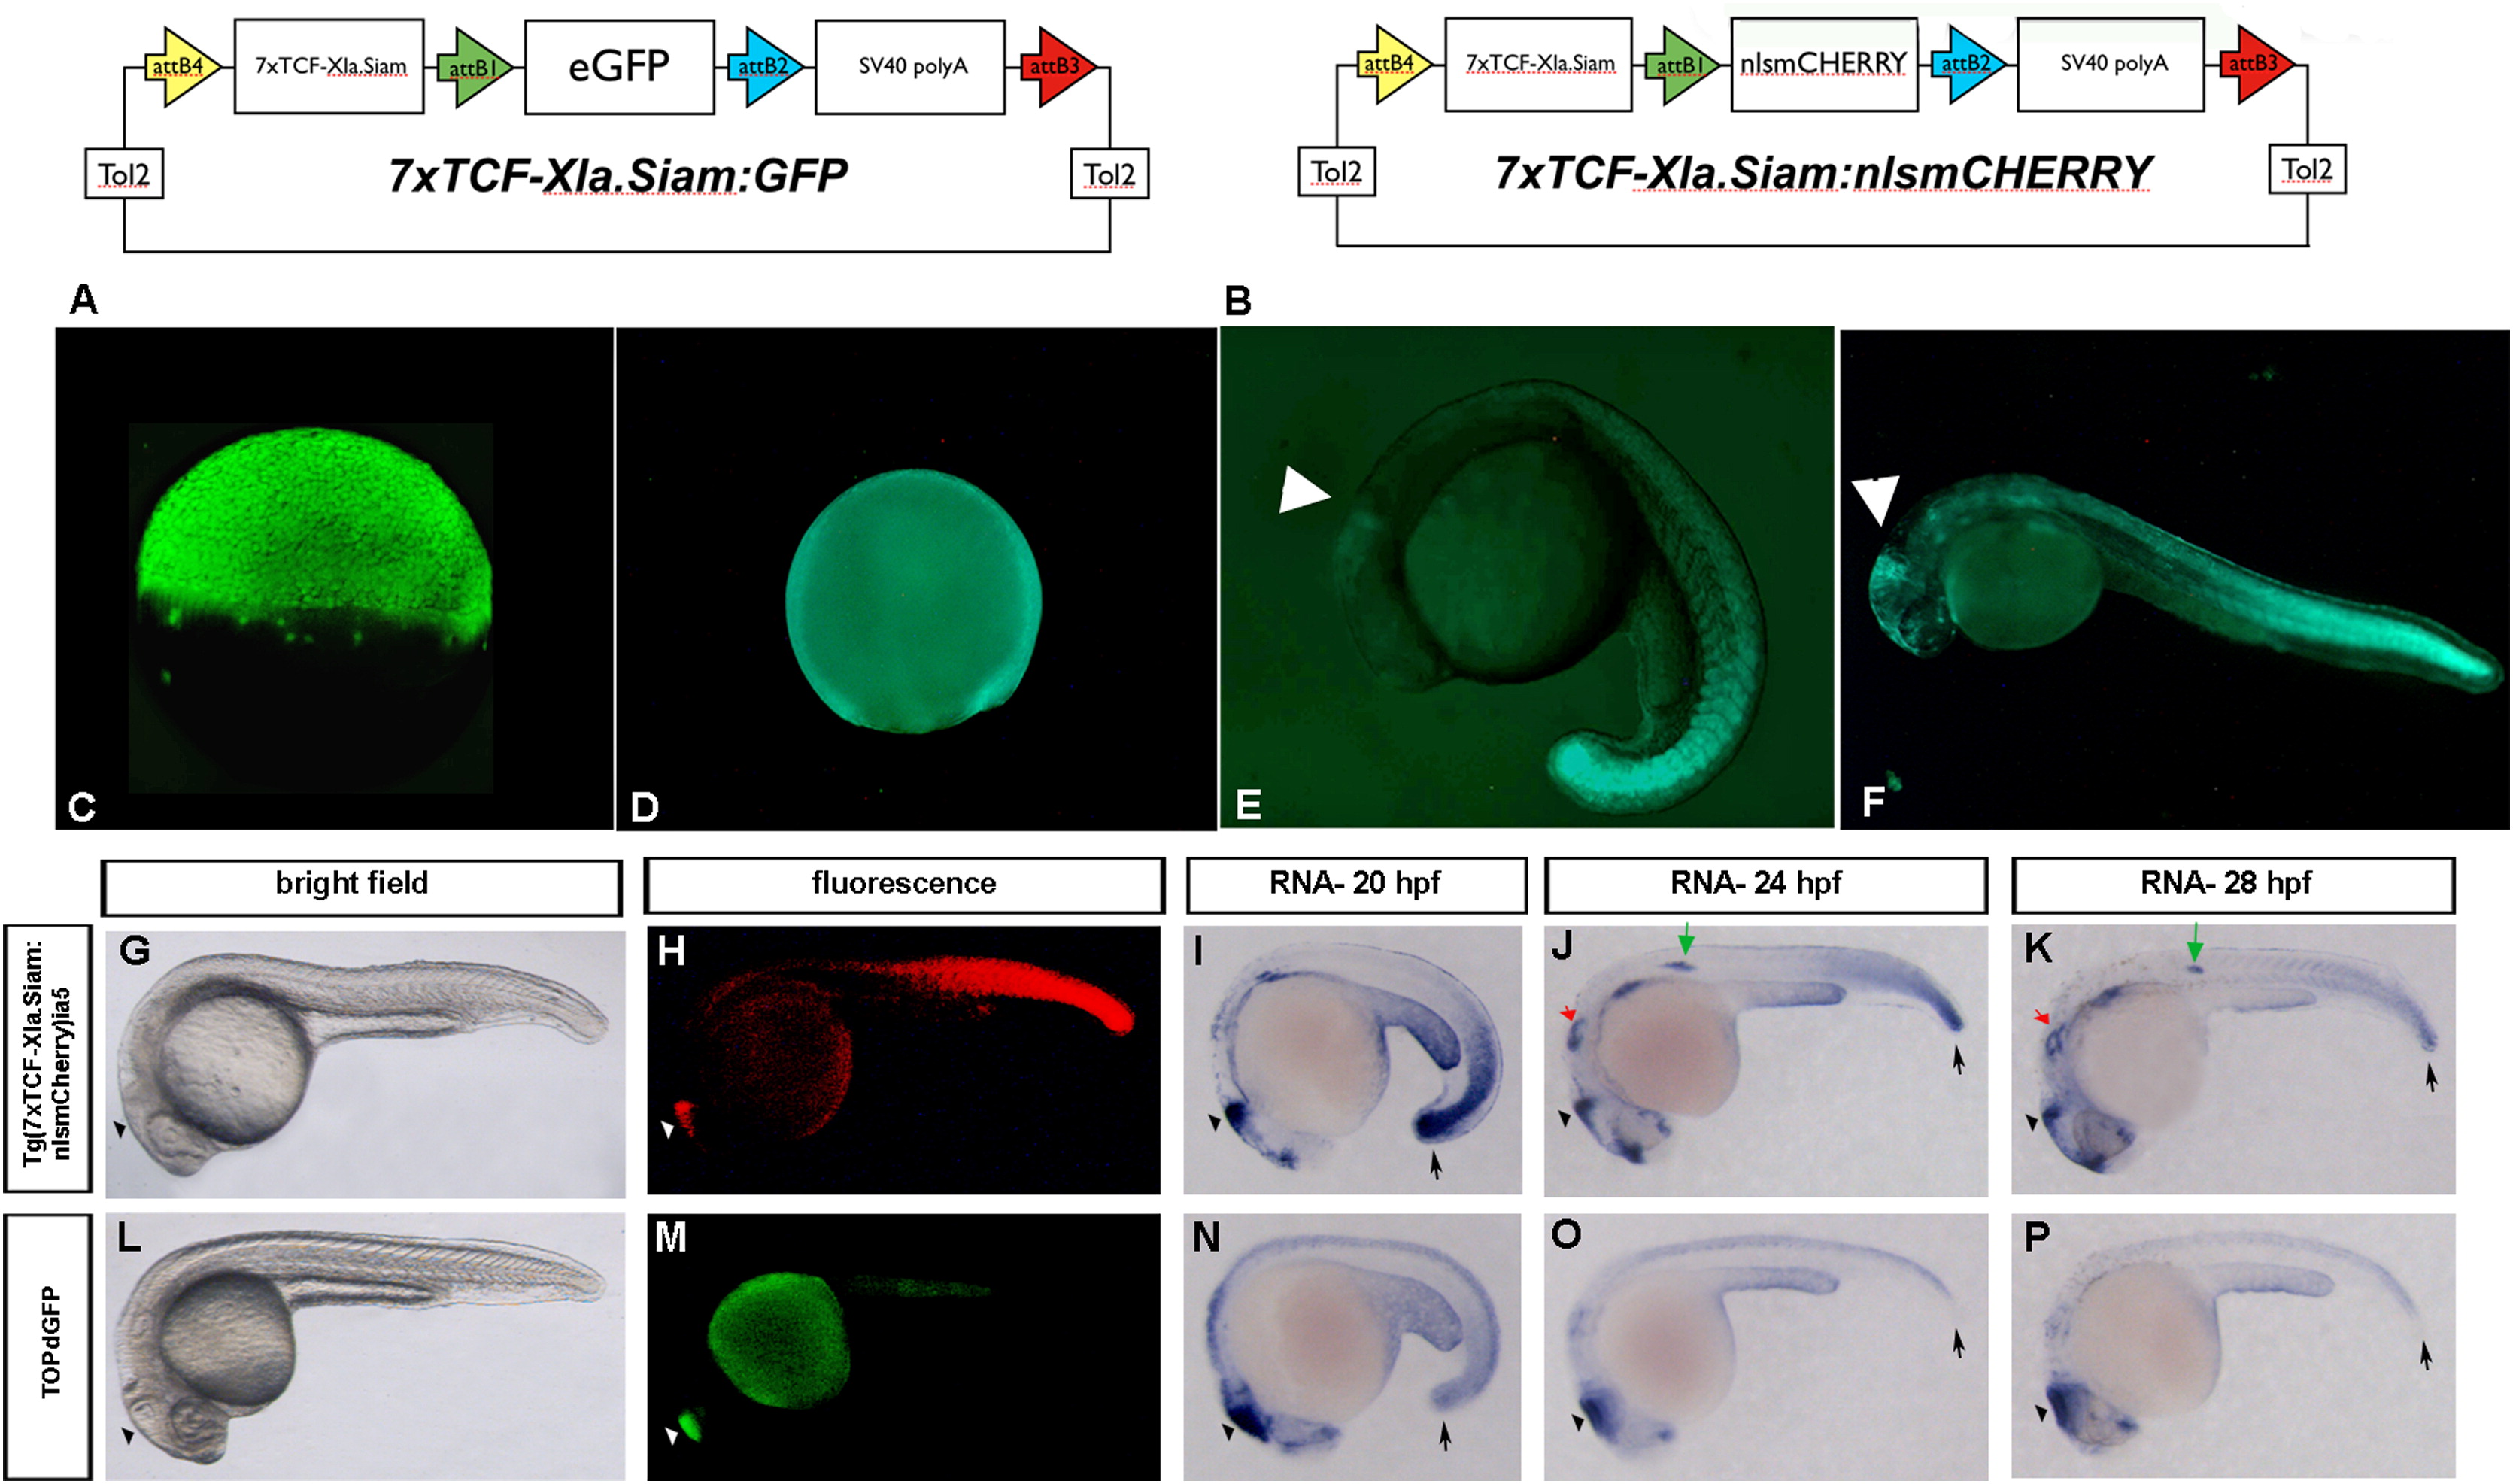
Fig. 1
Generation of the TCFsiam lines and comparison with the Tg(TOP:GFP)w25 fish. (A, B) Schematic rapresentations of the Tol-2 based vectors used to generate the Tg(7xTCF-Xla.Siam:GFP)ia4 line (vector shown in A) and the Tg(7xTCF-Xla.Siam:nlsmCherry)ia5 (vector shown in B). (C and D) Strong fluorescence is detectable in Tg(7xTCF-Xla.Siam:GFP)ia4 early staged embryos. Lateral views with anterior to the left are shown in C-P. At dome (C) and 80% epiboly (D) Tg(7xTCF-Xla.Siam:GFP)ia4 transgene expression is evident in all blastodermal cells. (E) During somitogenesis (19 hpf), eGFP is detected in the midbrain-hindbrain boundary (MHB) and in somites with a gradient distribution pattern. (F) 24-hpf embryo. Strong reporter expression is seen in the tail, while the gradient distribution is more clearly visible along the trunk. Positive cells are visible also in the fronto-nasal ectoderm and midbrain-hindbrain boundary (arrowhead). (G–P) Comparison of Wnt reporter activity under epifluorescence and by in situ hybridization in different embryonic stages reveals a stronger and broader reporter activity in Tg(7xTCF-Xla.Siam:nlsmCherry)ia5 embryos than in Tg(TOP:GFP)w25 embryos. (H and M) Reporter fluorescence in Tg(7xTCF-Xla.Siam:nlsmCherry)ia5 embryos is detectable anteriorly in the brain (arrowhead) and posteriorly in tail mesoderm, while in Tg(TOP:GFP)w25 embryos reporter activity is evident only in the brain. (I and N) Reporter transcription in both transgenic lines is detectable in the brain, while Tg(7xTCF-Xla.Siam:nlsmCherry)ia5 additionally display a much stronger activity in the posterior mesoderm at 20 hpf (arrows). (J,K and O,P) After 24 hpf, Wnt reporter transcription is additionally detectable in otic vesicles (red arrow in J and K) and lateral line primordium (green arrow in J and K) in Tg(7xTCF-Xla.Siam:nlsmCherry)ia5, but not in Tg(TOP:GFP)w25 embryos. I-K and N-P are 20, 24 and 28 hpf embryos stained for mCherry and TOPdGFP RNAs, respectively. G and L are brightfield images of the same embryos represented in H and M, respectively.
Reprinted from Developmental Biology, 366(2), Moro, E., Özhan, G., Mongera, A., Beis, D., Wierzbicki, C., Young, R.M., Bournele, D., Domenichini, A., Valdivia, L.E., Lum, L., Chen, C., Amatruda, J.F., Tiso, N., Weidinger, G., and Argenton, F., In vivo Wnt signaling tracing through a transgenic biosensor fish reveals novel activity domains, 327-340, Copyright (2012) with permission from Elsevier. Full text @ Dev. Biol.