
|
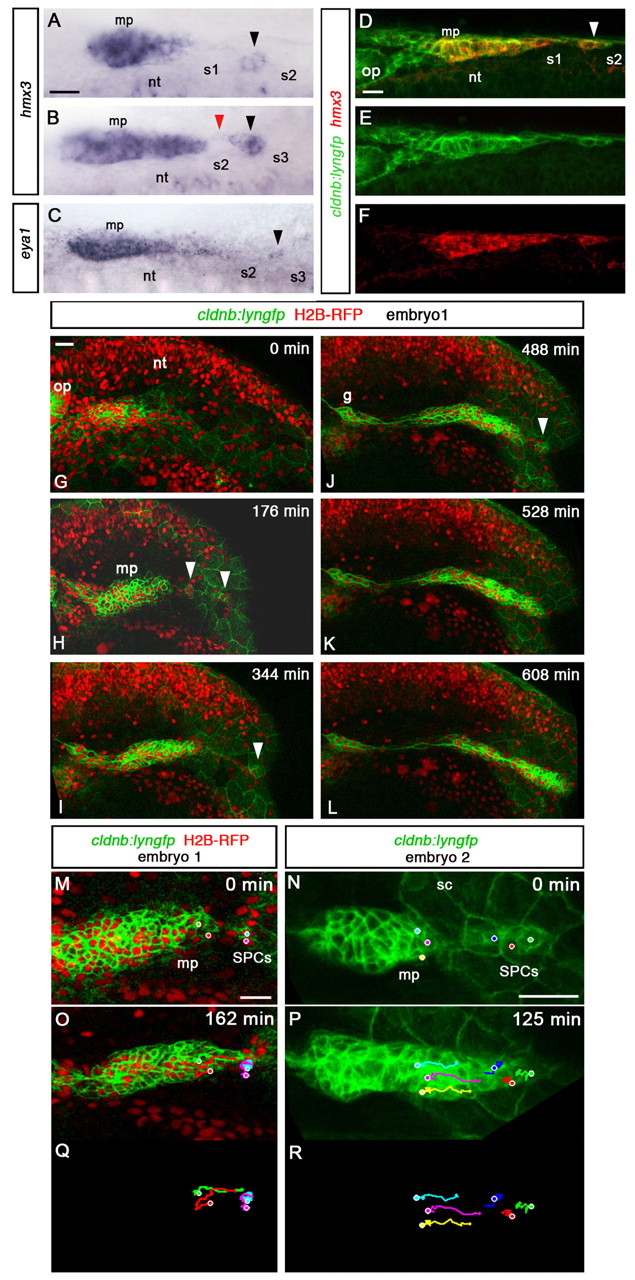
Fig. 1 SPCs have placode identity and fuse with the main primordium. All images are lateral views, anterior to the left, except A-F which show dorsal views. (A,B) hmx3 expression in the primordium at 22-24s. Black arrowheads indicate SPCs; the red arrowhead indicates fusion between SPCs and main primordium. (C) eya1 expression in SPCs (black arrowhead) at 20s. (D-F) Fluorescence detection of hmx3 mRNA (red) in cldnb:lyngfp (green) embryos at 20s. White arrowhead indicates SPCs. (G-L) Images from time-lapse microscopy performed from 18s on a cldnb:lyngfp embryo injected with H2B-RFP mRNA (supplementary material Movie 1). White arrowheads indicate SPCs. (M-R) Tracking of SPCs and primordium tip cells in embryo 1 (supplementary material Movie 1) and embryo 2 (supplementary material Movie 2) before the fusion. Dots in M and N indicate initial positions of tracked cells. O-R show final time points. g, posterior lateral line ganglion; mp, main primordium; nt, neural tube; op, otic placode; s, somite, sc, skin cells. Scale bars: 25 μm.