
|
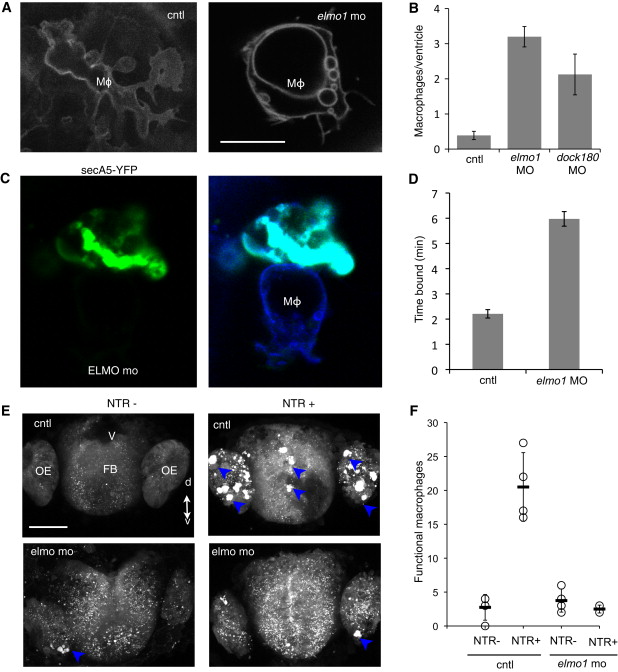
Fig. 4 Elmo1 Controls Engulfment by Primitive Macrophages in Zebrafish(A) Elmo1 deficient macrophages show large vacuoles and lack clear polarity seen in WT macrophages. Image shows a representative elmo1-deficient macrophage in the ventricle.(B) Quantification of macropinocytic macrophages inside the ventricle. Data are presented as mean ± SEM (n = 8).(C) Image showing a macrophage in elmo1 knockdown larvae bound to a mass of secA5-YFP+ apoptotic debris (Movie S4).(D) Quantification of the time from first encounter of secA5-YFP+ cell by a macrophage before being fully engulfed. The time bound for elmo1 MO may be an underestimate because most cells remained unengulfed at the end of the time-lapse observation.(E) Representative thick optical sections (maximal projections of confocal z stacks) showing fluorescent protein only and NTR;fluorescent protein forebrains of 72 hpf animals treated with metronidazole (1 μM). OE, olfactory epithelium; FB, forebrain; V, ventricle.(F) Quantification of macrophages as marked by fluorescent vacuoles and high motility, in animals described in (E). Circles indicate individual animals; black bars indicate mean. Macrophages are indicated by “MΦ” or by blue arrowheads (E), n = 4 animals, error bars represent SEM; p < 0.05. Scale bars represent 10 μm (A) and 50 μm (E). Also see Figure S3.