
|
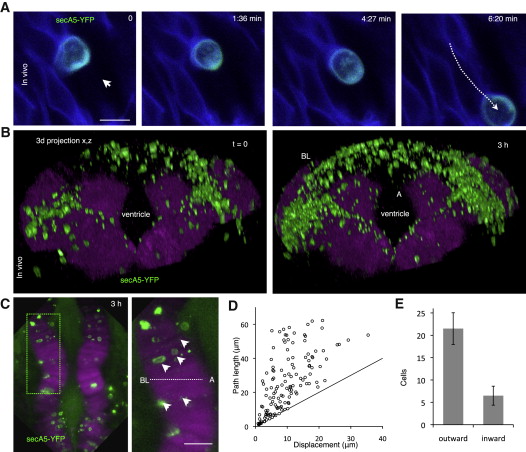
Fig. 1 Apoptotic Cells Migrate Directionally(A) Time-lapse images showing representative apoptotic cell emerging and moving through the neural tube. Apoptotic cell is marked in green (secA5-YFP, arrowhead), and neural tube tissue is marked by membrane-targeted GFP (mGFP, blue). Arrow and dotted line in last frame (6:20) indicates the path traveled by the apoptotic cell.(B) Images showing secA5-YFP transgenic animals (<30 hpf) treated with a low concentration of camptothecin (50 nM). Neuronal cells are marked with red fluorescent protein. Three-dimensional projections (caudal view) of z stacks were acquired in treated animals at the indicated intervals (apoptotic cells labeled in green, secA5-YFP). First panel (t = 0) is 6 hr after drug treatment when apoptotic cells start to be induced, second panel (t = 3) indicates 3 hr later.(C) Apoptotic cells (inset, arrowheads) emerge throughout the neural tube, indicating that cell death induction is independent of position in the neural tube. Scale bars represent 5 μm (A) and 25 μm (C).(D) Plot shows the path length (total distance) and the displacement (net distance traveled) for dying cells. x = y line indicates optimal directional persistence.(E) Quantification of cells showing net migration outward and inward in the neural tube. Data are represented as mean ± SEM. Also see S1.