
|
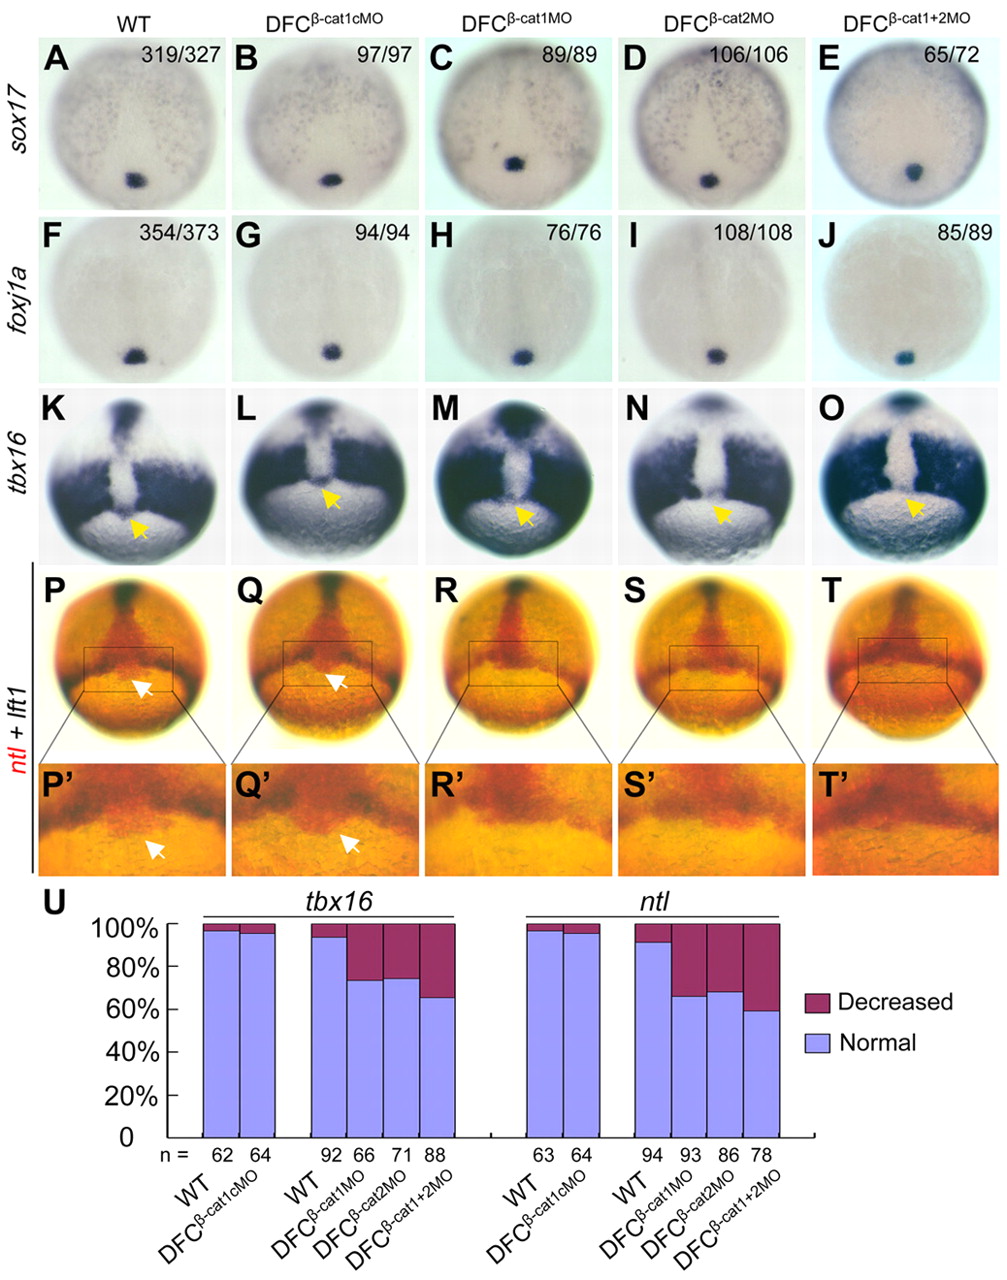
Fig. 8
Effects of ctnnb1 and ctnnb2 knockdown in DFCs on DFCs-specific marker gene expression. Embryos at the 512-cell stage were injected and later examined for marker expression. (A-J) sox17 (A-E) and foxj1a (F-J) expression in DFCs at the 90% epiboly stage were unaltered in morphants. In the top right-hand corner of each picture are the number of embryos with the representative phenotype versus the total number of analyzed embryos. (K-O) tbx16 expression in DFCs at 75% epiboly stage was disrupted in morphants. Yellow arrows indicate the position of DFCs. (P-T) ntl expression in DFCs at 75% epiboly stage was impaired in morphants. Two-color in situ hybridization using ntl (red) and lft1 (dark purple) probes were performed. The expression domain of ntl in DFCs was indicated by white arrows. (P′-T′) Higher magnification images of the boxed areas in P-T. (U) Statistical data for ntl and tbx16 expression in DFCs. All embryos are shown as dorsal views with animal pole towards the top.