
|
Fig. 2
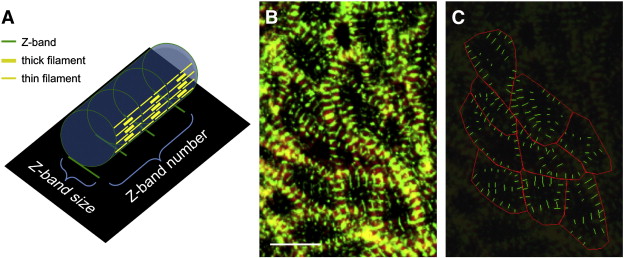
Method for quantification of myofibril content. (A) Schematic depicts a three-dimensional model of a cylindrical myofibril (blue cylinder), with a two-dimensional projection of its Z-bands (black rectangle). Sarcomere organization is illustrated on the side of the cylindrical myofibril. The green rings represent Z-bands, which are equidistant and intersected with thin and thick filaments (yellow lines) perpendicularly. In our confocal images, we view a two-dimensional projection of this type of three-dimensional object, such that Z-bands appear as line segments (green lines on black rectangle). In the two-dimensional projection, the length of a myofibril is represented by the number of parallel Z-bands, and the thickness of a myofibril is represented by the size of each Z-band. (B, C) Localization of cortical actin and Z-bands in the ventricle at 48 hpf, visualized by phalloidin and α-actinin antibody staining (B), can be converted into measurable objects (C). Red polygons, tracing cell boundaries, are used to quantify cell surface area. Green line segments, tracing Z-bands, are used to quantify Z-band size. Scale bar is 10 μm. See Materials and methods and Fig. S1 for additional details regarding our imaging and measurement methods. Method for quantification of myofibril content. (A) Schematic depicts a three-dimensional model of a cylindrical myofibril (blue cylinder), with a two-dimensional projection of its Z-bands (black rectangle). Sarcomere organization is illustrated on the side of the cylindrical myofibril. The green rings represent Z-bands, which are equidistant and intersected with thin and thick filaments (yellow lines) perpendicularly. In our confocal images, we view a two-dimensional projection of this type of three-dimensional object, such that Z-bands appear as line segments (green lines on black rectangle). In the two-dimensional projection, the length of a myofibril is represented by the number of parallel Z-bands, and the thickness of a myofibril is represented by the size of each Z-band. (B, C) Localization of cortical actin and Z-bands in the ventricle at 48 hpf, visualized by phalloidin and α-actinin antibody staining (B), can be converted into measurable objects (C). Red polygons, tracing cell boundaries, are used to quantify cell surface area. Green line segments, tracing Z-bands, are used to quantify Z-band size. Scale bar is 10 μm. See Materials and methods and Fig. S1 for additional details regarding our imaging and measurement methods.
Reprinted from Developmental Biology, 362(2), Lin, Y.F., Swinburne, I., and Yelon, D., Multiple influences of blood flow on cardiomyocyte hypertrophy in the embryonic zebrafish heart, 242-253, Copyright (2012) with permission from Elsevier. Full text @ Dev. Biol.