
|
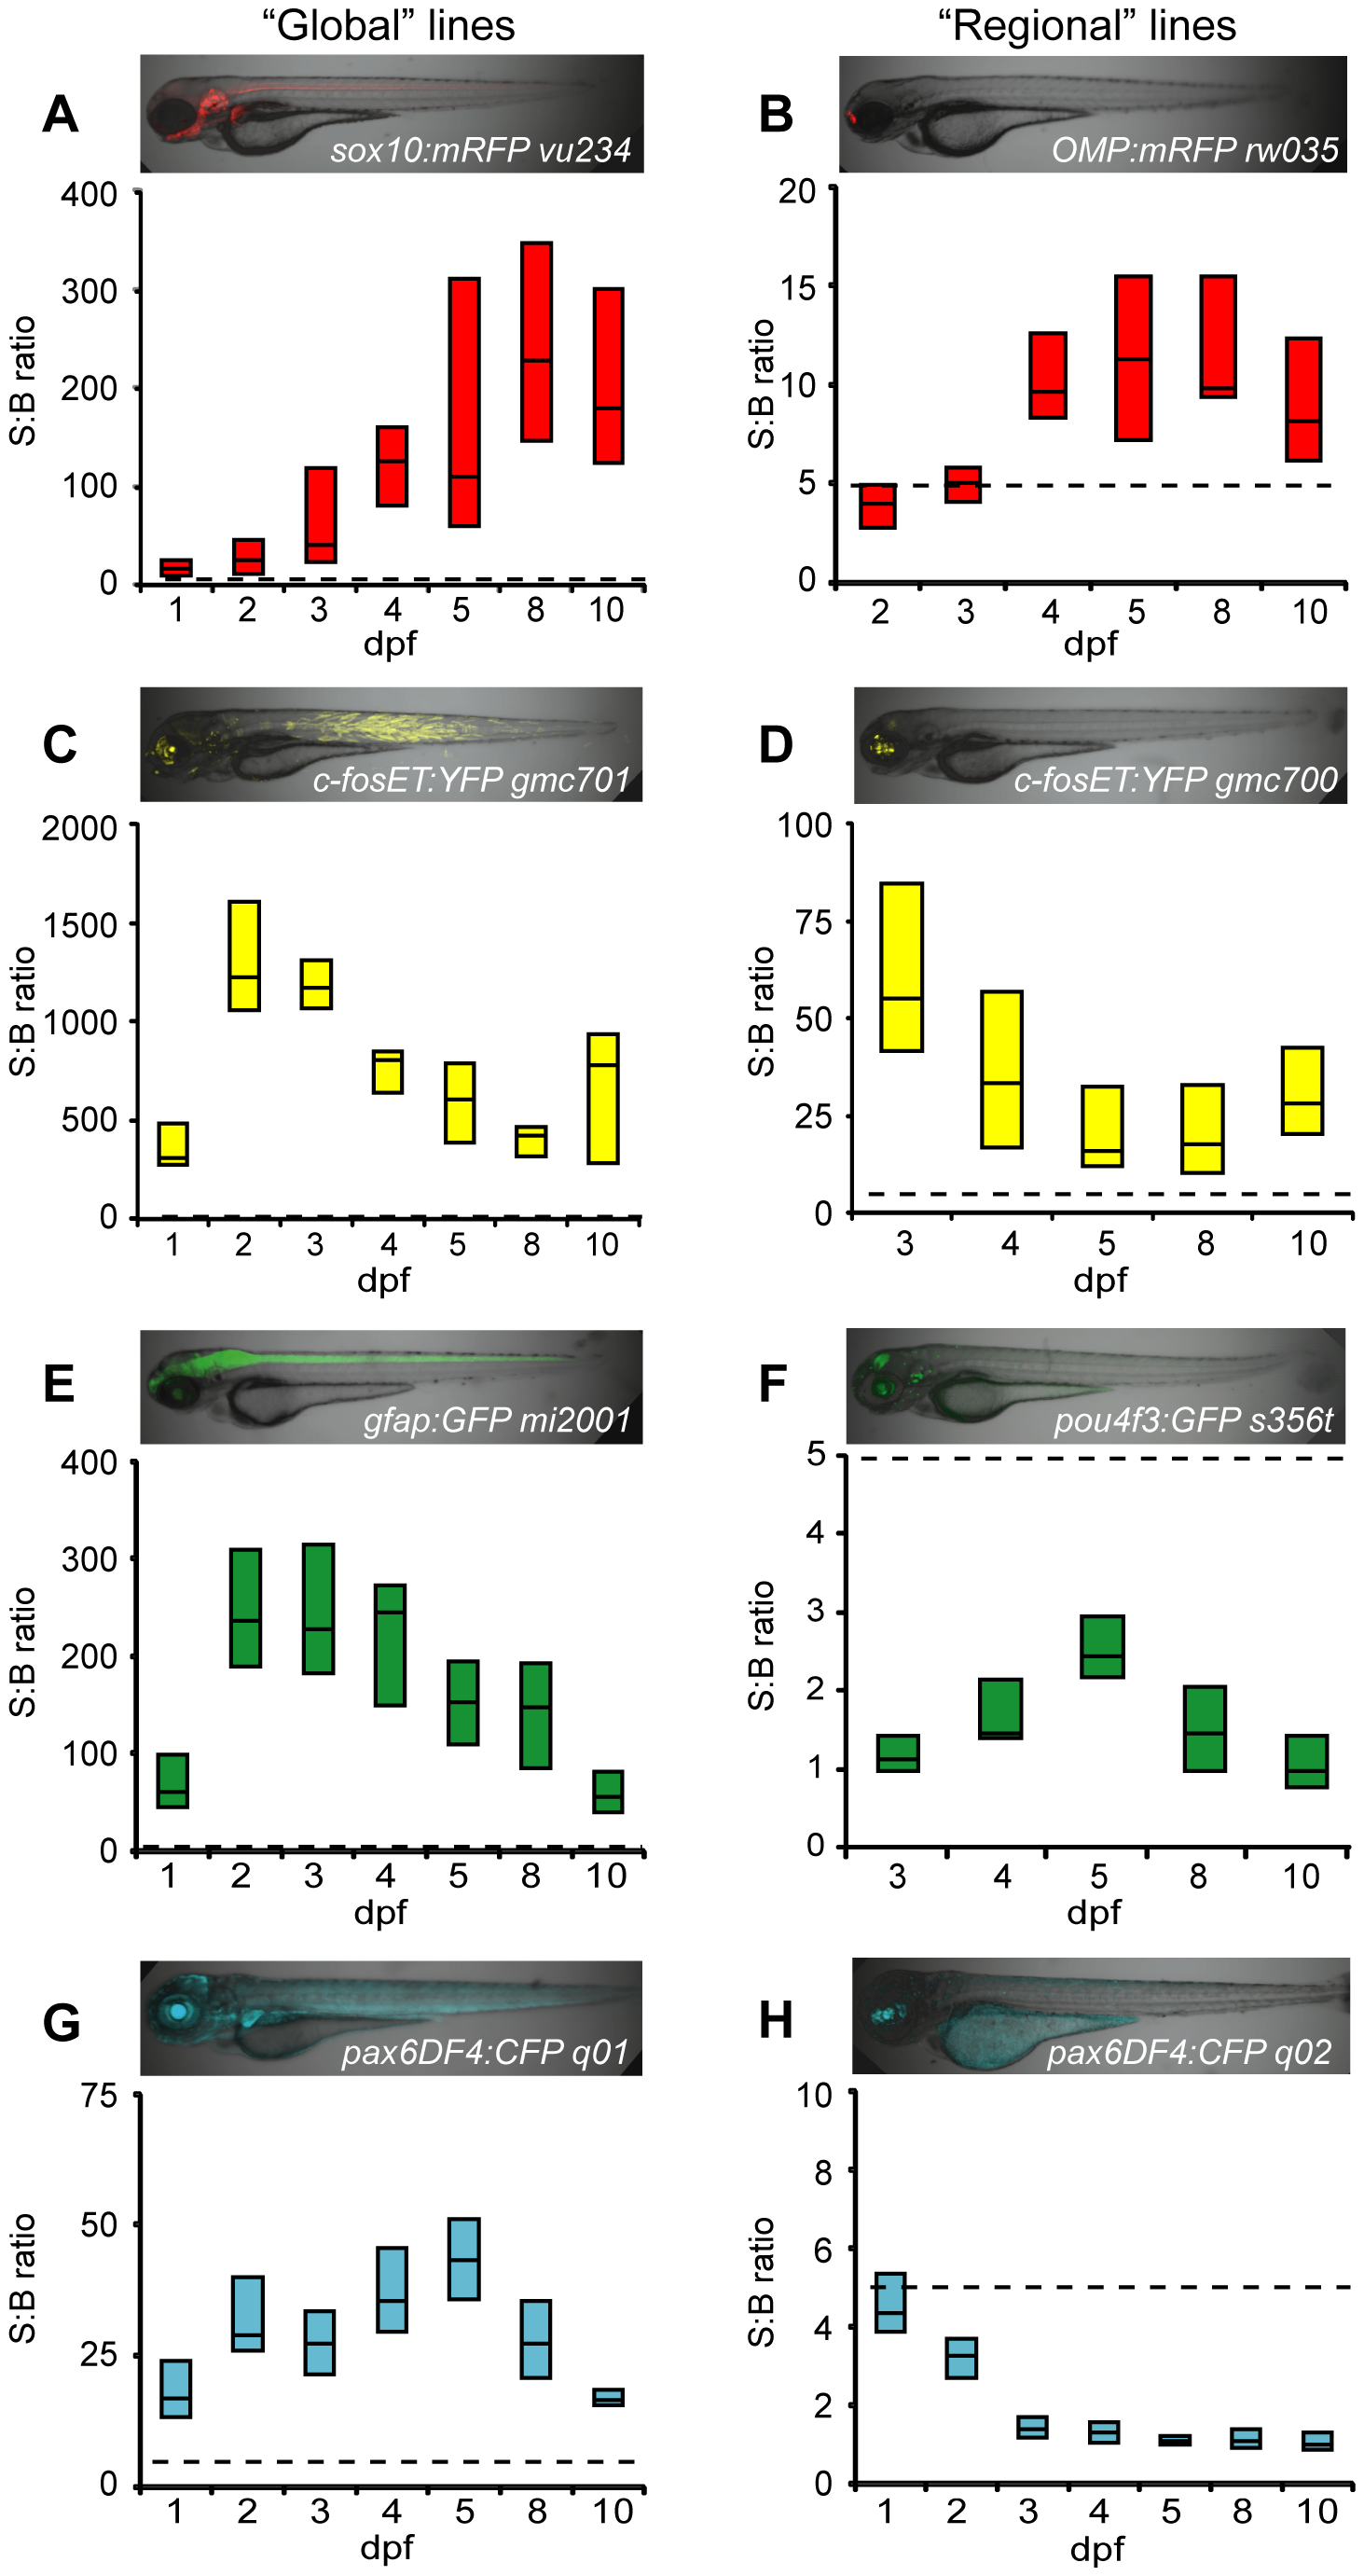
Fig. 2
Comparison of fluorescent reporters.
Box plots of S:B ratios of transgenic lines expressing different fluorescent reporters across time: A–B) mRFP; C–D) EYFP; E–F) EGFP; G–H) ECFP. Micrographs show the expression patterns of each line. ARQiv scans were performed starting from the earliest day reporter could be detected through 10 dpf. All ‘global’ expressing lines (A,C,E,G) had S:B ratios consistent with excellent HTS assay quality (Z′-factore0.5 across ages tested, see Table 3). In contrast, only “red” fluorophore (B) and YFP (D) expressing “regional” lines produced S:B ratios consistent with HTS (see Table 3). Box plots: bottom line is the 25th percentile, top line the 75th percentile, interface between boxes represents the median (n = 8–24 subjects per line). Note: y-axis ranges differ markedly, dashed line indicates 5:1 ratio of S:B for comparisons of levels across transgenic lines.