
|
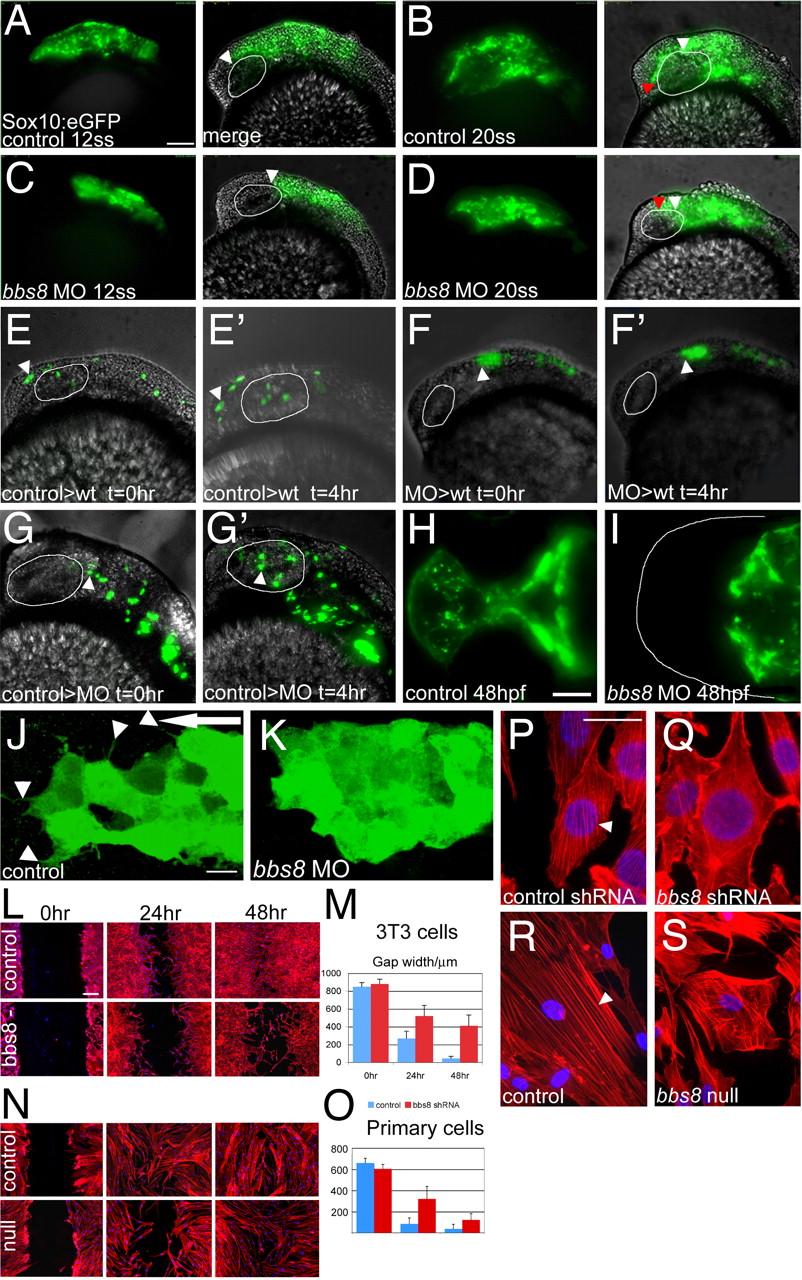
Fig. 3
Neural crest migration in bbs8 morphants. (A and B) Sox10:GFP transgenic zebrafish showing migration of CNCCs anteriorly between 12 (A) and 20ss (B). The amount of movement over the 4-h period is represented in B by the difference between the white (position at 12ss) and red (position at 20ss) arrowheads, H250 μm. (C and D) Inhibition of CNCC migration in bbs8 morphants. Only a small distance (80 μm) moved in the 4-h period. (E and E2) NCCs from control MO-injected embryos grafted into control hosts migrate anteriorly to populate the head. The arrowhead shows the position of the anteriormost cell showing its change in position over the 4-h period. (F and F2) Cells taken from bbs8 morphant donors fail to migrate when transplanted into control hosts, suggesting that the migration defect is cell autonomous. (G and G2) Control cells transplanted into bbs8 morphant hosts migrate as normal. (H and I) Control and morphant embryos at 48 hpf showing Sox10:eGFP expression in the developing trabeculae that fail to elongate in morphants. (J) Migrating control CNCCs at 14ss showing polarized filopodial protrusions (arrowheads) mainly in the direction of migration (large arrow). (K) bbs8 morphant CNCCs remain tightly clustered and lack polarized protrusions. (L) In vitro scratch wound healing assay on 3T3 cells shows delayed closure of the gap in Bbs8 knockdown cells compared with controls. (M) Graph quantifying the gap width over the 48-h time course. (N) The same wound healing assay using primary fibroblasts taken from unaffected and BBS8 -/- patients also shows delayed migration. (O) BBS8 patient cells migrate slower than control. (P) Polarized actin microfilaments in control 3T3 cells migrating into the wound gap. (Q) Bbs8 knockdown cells have a disordered actin cytoskeleton. (R and S) This disorder is recapitulated in migrating patient primary fibroblasts. [Scale bars: 100 μm (A–G2), 100 μm (H and I), 20 μm (J and K), 200 μm (L and N), and 20 μm (P–S).]