
Image
|
Figure Caption
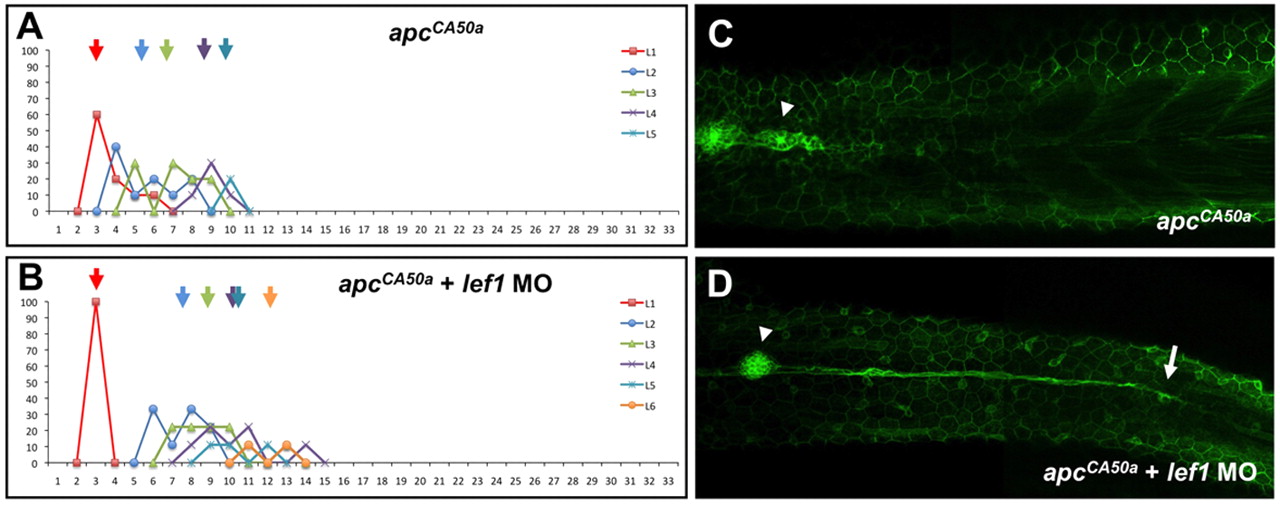
Fig. 7 Lef1 is epistatic to APC in controlling leading zone cell behaviour. (A,B) Histogram depicting the number/position of neuromasts in apcCA50a (A) and apcCA50a mutant/lef1-morphant (B) embryos. Arrows indicate the average position and colours denote the different populations of sequentially deposited neuromasts. (C,D) apcCA50a (C) and apcCA50a mutant/lef1-morphant (D) Tg(-8.0cldnb:lynEGFP)zf106 embryos showing groups of cells migrating caudally after the primordium has stalled (arrowheads). Arrow in D indicates the extended trail of cells in morphants.
Figure Data
Acknowledgments
This image is the copyrighted work of the attributed author or publisher, and
ZFIN has permission only to display this image to its users.
Additional permissions should be obtained from the applicable author or publisher of the image.
Full text @ Development