
Image
|
Figure Caption
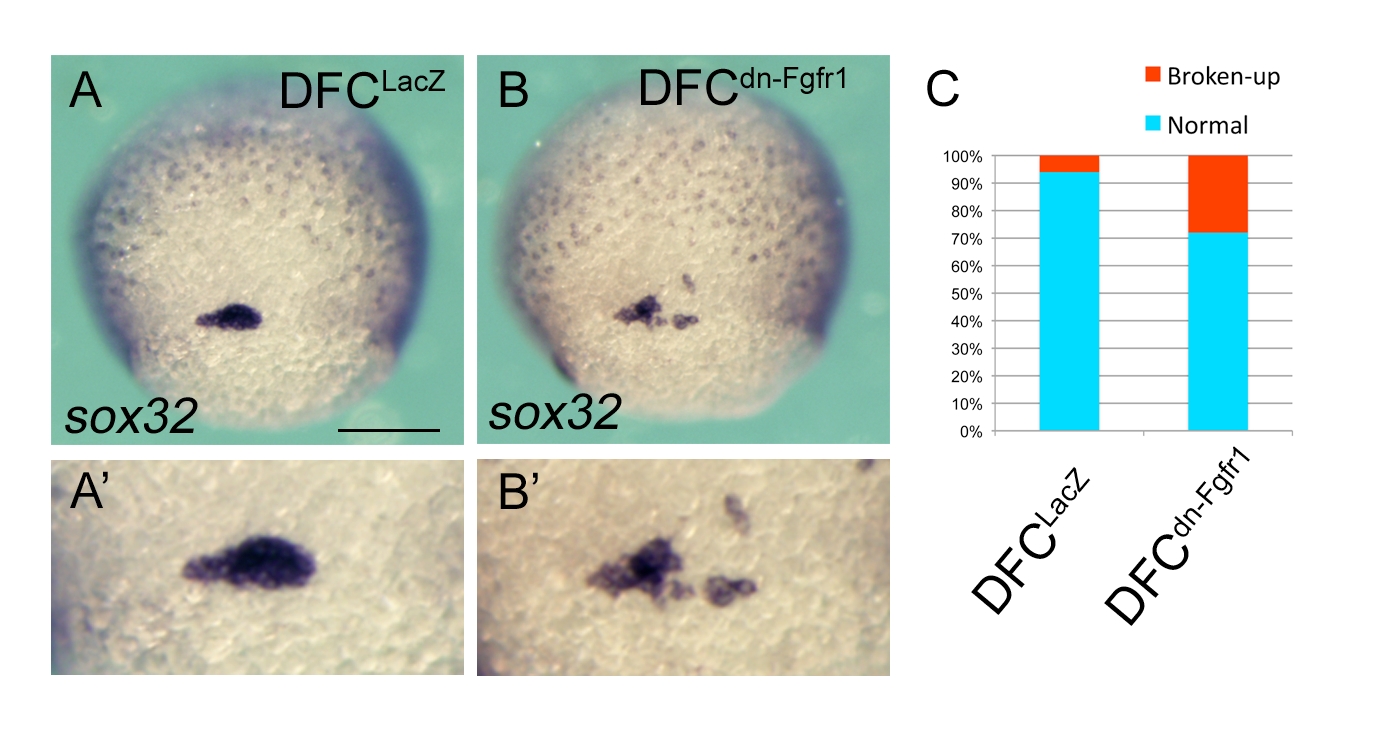
Fig. S12
DFC-specific overexpression of dn-Fgfr1 can lead to broken-up DFC clusters. (A, B) Dorsal view of sox32 expression of DFCLacZ-injected (A) or DFCdn-Fgfr1-injected (B) embryos. Scale bar: 200 μm. (C) Percentages of normal or broken-up DFCs were scored using the sox32 expression pattern in DFCLacZ-injected (n = 54) or DFCdn-Fgfr1-injected (n = 47) embryos. A significant difference (P = 0.0025) could be seen between DFCLacZ and DFCdn-Fgfr1.
Acknowledgments
This image is the copyrighted work of the attributed author or publisher, and
ZFIN has permission only to display this image to its users.
Additional permissions should be obtained from the applicable author or publisher of the image.
Full text @ Proc. Natl. Acad. Sci. USA