
|
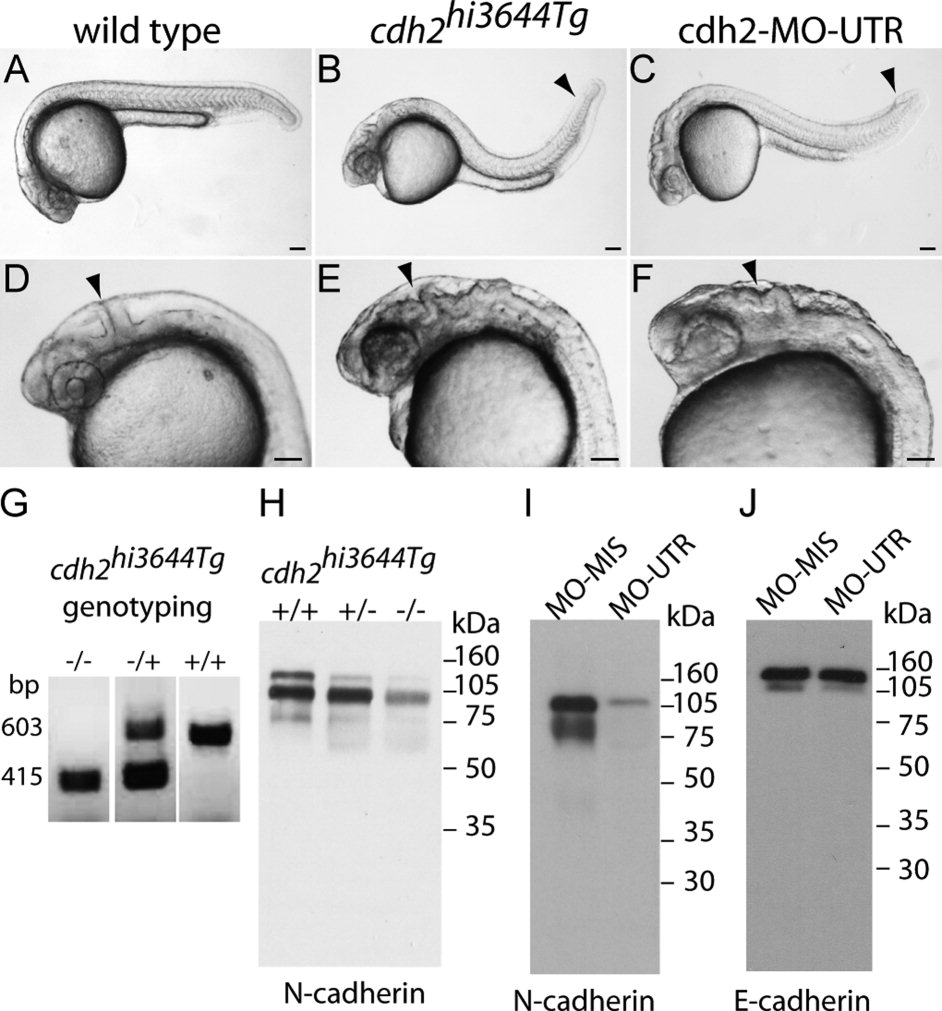
Fig. 3
Analysis of cdh2hi3644Tg N-cadherin mutant zebrafish embryos. A,D: Photographs of 24 hpf wild-type zebrafish embryos. The arrowhead in D points to the midbrain–hindbrain boundary. B,E: 24 hpf cdh2hi3644Tg homozygote mutant embryos show defective tails (B, arrowhead) and disruption of the midbrain–hindbrain boundary (E, arrowhead). C,F: 24 hpf zebrafish embryos injected at the one-cell stage with antisense N-cadherin morpholinos (cdh2-MO-UTR). Knock-down of N-cadherin expression causes defective tail morphogenesis (C, arrowhead) and loss of the midbrain–hindbrain boundary (F, arrowhead). G: Genotyping of cdh2hi3644Tg embryos: +/+, wild type; forward and reverse primers anneal to N-cadherin (603 bp); –/–, homozygotes; forward primer anneals to the viral sequence and reverse primer anneals to N-cadherin sequence (415 bp); –/+, heterozygotes; both bands are detected. H: Immunoblot analysis of N-cadherin expression in tissue homogenates from 24 hpf embryos obtained from a cross of cdh2hi3644Tg heterozygous mutants. Embryos were genotyped and pooled as wild type (+/+), heterozygote (+/–), and homozygote (–/–), and homogenates were electrophoresed in a 10% SDS-polyacrylamide gel, transferred to a PVDF membrane, immunoblotted with MNCD2 antibodies, and detected by chemiluminescence. MNCD2 antibodies detected two bands of <105 kDa and <120 kDa. Densitometric analysis was used to quantify the relative amount of N-cadherin in each sample, which is expressed as percentage of wild type: +/+, wild type 100%; +/–, heterozygotes 64%; and –/–, homozygotes 22%. I: Immunoblot analysis with MNCD2 antibodies of N-cadherin expression in 96 hpf wild-type zebrafish larvae injected at the one-cell stage with antisense morpholinos against N-cadherin UTR (MO-UTR). Embryos injected with an N-cadherin antisense mismatched morpholino (MO-MIS) were used as control. MNCD2 detected two bands of <105 kDa and –120 kDa. J: Western blot of the same samples electrophoresed in I and immunoblotted with anti-E-cadherin antibodies revealed two bands of <120 kDa and <140k Da. E-cadherin protein expression levels were not affected by injection with N-cadherin antisense morpholinos. Scale bars = 0.1 mm.