
|
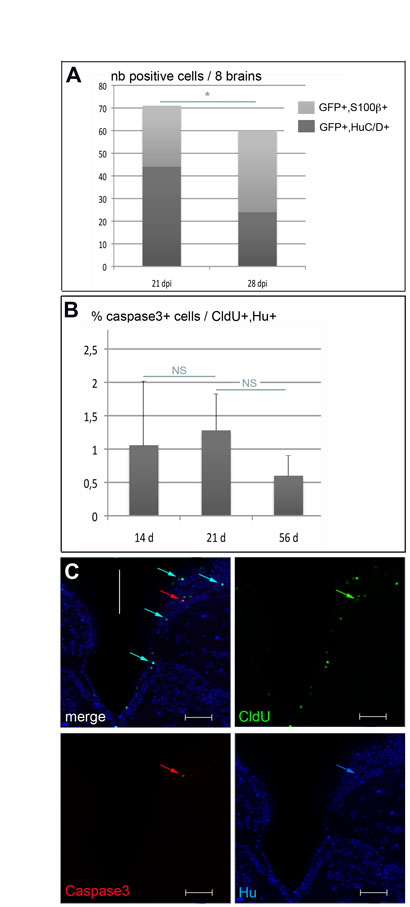
Fig. s2
Loss of GFP-positive neurons over time and cell death analysis in the adult pallium. (A) Number of GFP-positive cells that co-express neuronal (HuC/D, blue) or glial (S100β, red) markers in the pallium at 21 and 28 dpi following retroviral infection (n=8 in each case). The differences observed are significant (unpaired t-tests, *P=0.01 and 0.018, respectively, for S100β-positive and Hu-positive cells). (B) Percentage of CldU, HuC/D double-positive cells that co-express the caspase 3 apoptotic marker 14, 21 and 56 days after CldU incorporation (calculated from a total of 353, 937 and 902 CldU+, HuC/D+ cells counted on 27, 29 and 18 slices, respectively, n=4 in each case). The proportion of dying newborn neurons is very low (respectively 1.05, 1.28 and 0.6%) and does not significantly vary with the age of the adult-born HuC/D-positive cells (unpaired t-tests: P>0.4 for both pair-wise comparisons). (C) Triple immunostaining for CldU (green), HuC/D (blue) and caspase 3 (red) in the adult pallium 21 days after a 24-hour CldU pulse. Numerous CldU+, HuC/D+ cells are visible (cyan arrows in top left panel), of which one co-expresses caspase 3 (red, green and blue arrows). Cross-sections of the telencephalon observed in confocal microscopy, white bar to the midline. Scale bars: 50 μm.