
|
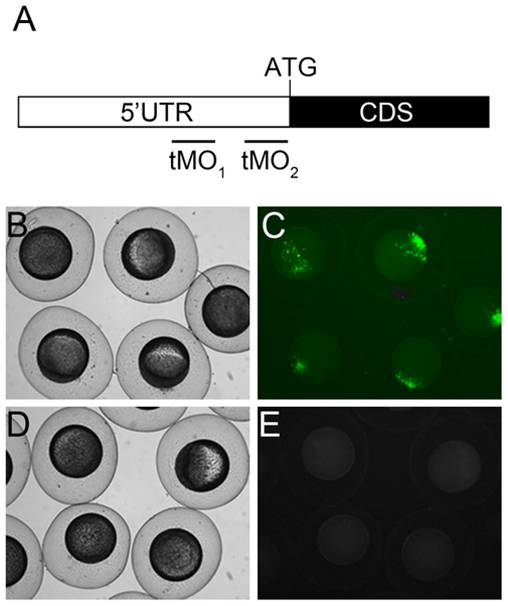
Fig. 2 ptenb MO target sites and potency examination.
(A) Partial mRNA map of ptenb. The black and white boxes represent part of the coding sequence (CDS) with ATG translation initiation site and 5′ untranslated region (UTR), respectively. The ptenb tMO1 and tMO2 binding sites are located at the 5′ UTR as shown. The potency of tMO1 to reduce ptenb expression was shown by co-injecting 150 pg PCS2+_ptenb 5′ UTR plasmid, which containing the tMO1 binding site, with or without 5 ng tMO1. Representative photographs of control (B,C) and morphant embryos (D,E) under bright (B,D) and dark fields (C,E) are shown. These experiments were repeated 3 times.