
|
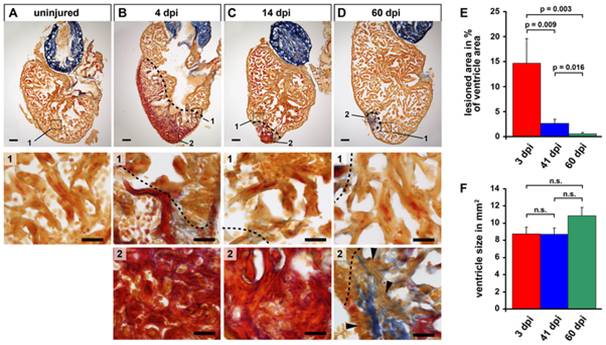
Fig. 1 The zebrafish heart regenerates after cryoinjury induced tissue damage.
(A–D) Sections of uninjured control hearts (A) and hearts at 4 (B), 14 (C) and 60 (D) days after cryolesion (dpi = days post injury) stained with Acid Fuchsin Orange G, which labels cardiomyocytes in orange, fibrin in red and collagen in blue. Magnification #1 of uninjured heart shows healthy myocardium. Magnifications #1 of injured hearts show cardiomyocytes at the lesion edges and parts of wound tissue. Close up views of the lesioned area are shown in magnifications #2. Note that the lesioned area, showing fibrin accumulation at 4 dpi and 14 dpi and minor deposits of collagen at 60 dpi is decreasing in size. Cardiomyocytes are missing at 4 and 14 dpi and at 60 dpi remaining collagen rich tissue is interspersed with cardiomyocytes (arrowheads). Wound edges are indicated by a black dashed line. Scale bars: 100 μm in overviews, 25 μm in close ups. (E) Quantification of the lesioned area normalized to the size of the ventricle. Measurements were performed on all serial sections for each heart. Error bars = s.e.m., significance tested by Student′s t-test (41 dpi and 60 dpi) and Mann-Whitney rank sum test (others). n = 5 hearts 3 dpi (73 sections), 6 hearts 41dpi (89 sections), 7 hearts 60 dpi (118 sections). (F) Quantification of the ventricular area of the hearts analyzed in E. Measurements were done on all sections for each heart. Significance tested by Student′s t-test (41 dpi and 60 dpi) and Mann-Whitney rank sum test (others).