
|
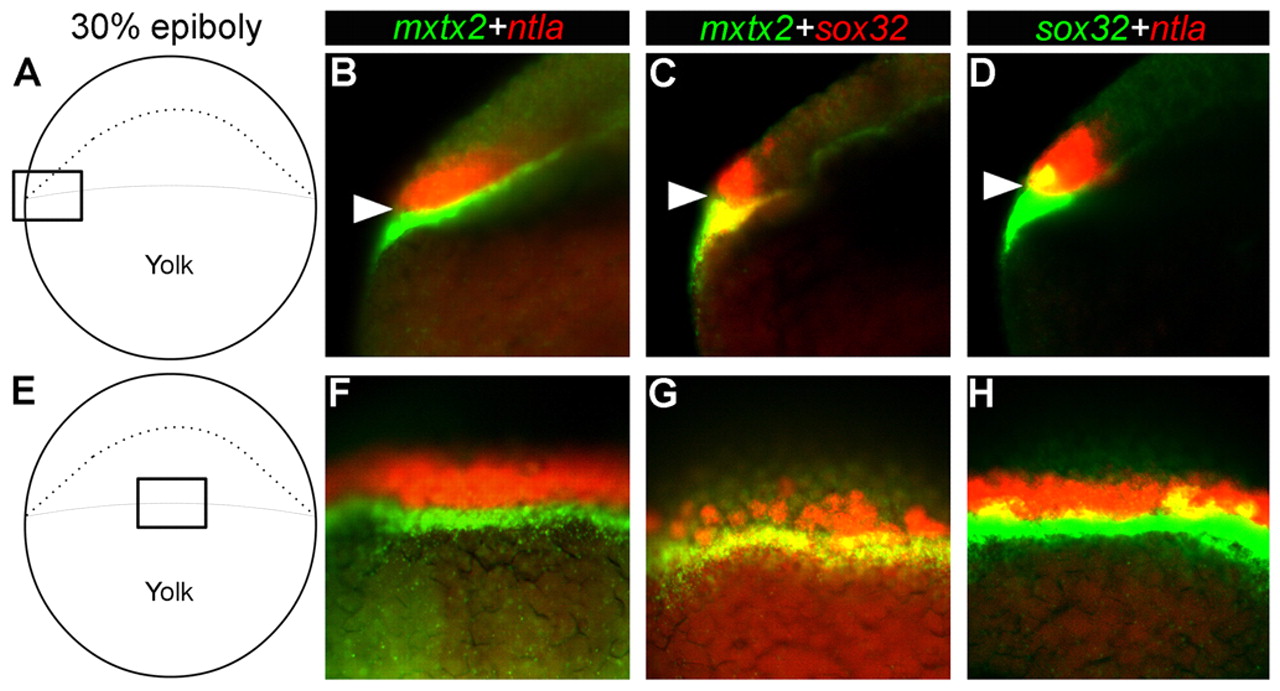
Fig. 5 Confinement of ntla transcripts to the embryonic margin and mxtx2 transcripts to the YSL. (B-D,F-H) Double fluorescence WISH was performed on WT zebrafish embryos at the 30% epiboly stage, with mxtx2 labeled in green, ntla in red and sox32 in red or green (as indicated by the text color). Overlapping expression appears in yellow. (A,E) Schematics indicating the embryonic regions (boxed) visualized in B-D and F-H, respectively. sox32 expression completely overlaps with mxtx2 in the YSL (C,G) and partially overlaps with ntla in the margin (D,H). By contrast, no overlap is seen between mxtx2 in the YSL and ntla in the margin (B,F). The thin yellow line in B and F, which is far narrower than a single cell, is an optical bleeding artifact. Arrowheads indicate the YSL-margin boundary.